Machine fault frequencies
Key references: Norton & Karczub 2003 Randall & Antoni 2011 McFadden & Smith 1984
Condition monitoring begins with arithmetic, not with signal processing. Every rolling-contact bearing, gear pair, induction motor and bladed rotor excites a family of discrete frequencies fixed by its geometry and its shaft speed, and knowing where those lines fall is what turns a featureless spectrum into a diagnosis: a peak is only evidence when it sits on a named line. This page covers the kinematics of M. P. Norton and D. G. Karczub, Fundamentals of Noise and Vibration Analysis for Engineers (2nd ed., Cambridge University Press, 2003), Section 8.4, and how they combine with the signal chain the library already provides - the envelope spectrum and cepstrum and time synchronous averaging.
The working view is the two put together: the envelope spectrum of a band-passed vibration record with the predicted lines drawn on top and named.
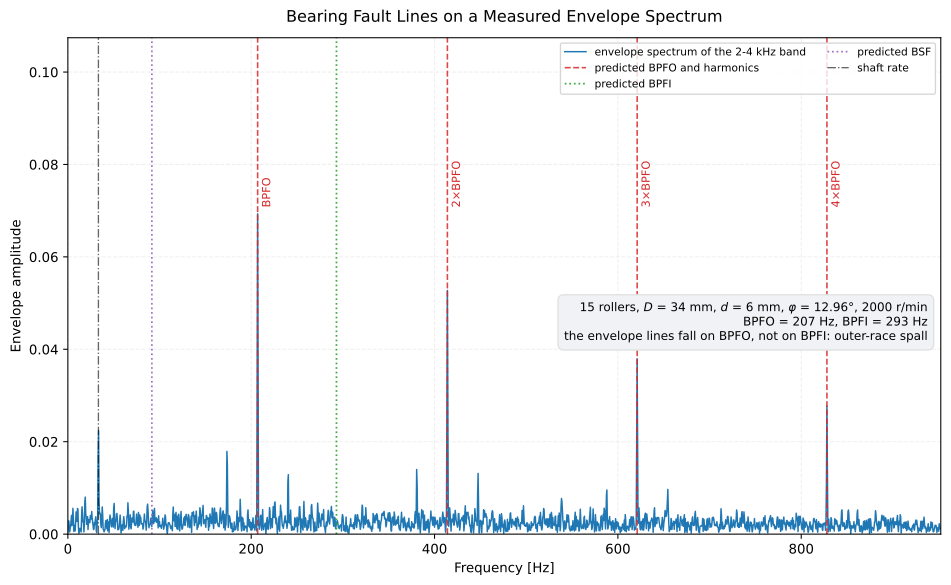
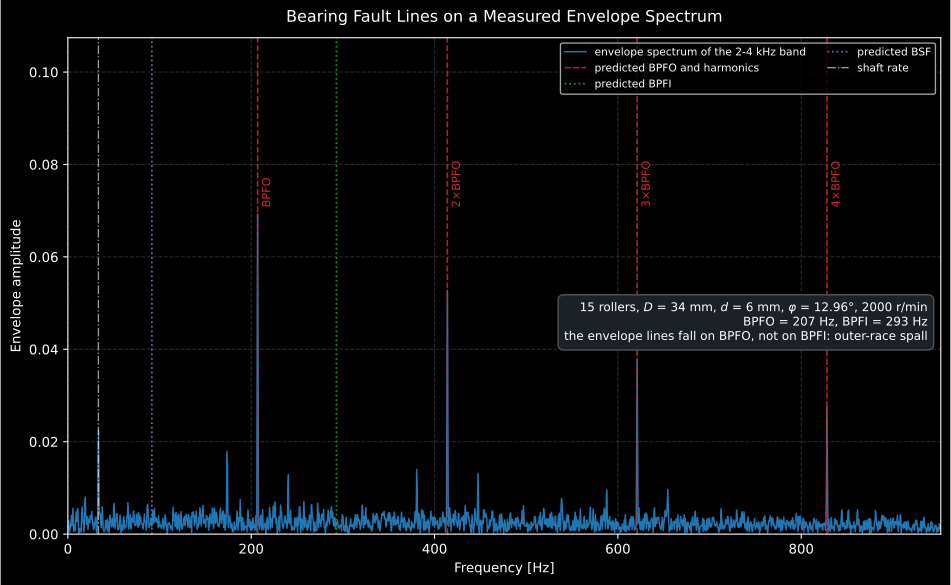
The four tall lines land on BPFO and its harmonics; nothing appears on BPFI, on the roller rate BSF or on the 183 Hz BDF where a damaged roller would strike. That is the diagnosis: a spall on the outer race. The small line at the shaft rate, 33.3 Hz, is the unbalance of this record turning the load once per revolution, which section 1 comes back to.
Show the code for this figure
import matplotlib.pyplot as pltimport numpy as npfrom phonometry import signals, vibration
# The bearing: 15 rollers on a 34 mm pitch diameter_m, 6 mm rollers,# 12.96 degrees contact angle, shaft at 2000 r/min.faults = vibration.bearing_fault_frequencies(2000.0, 15, 6.0, 34.0,                                             contact_angle_deg=12.96)bpfo, shaft = faults["BPFO"], faults.shaft_rate    # 207.0 Hz, 33.33 Hz
# A spalled outer race: one impact per BPFO period, each ringing a 3 kHz# housing resonance, load-modulated once per revolution, buried in noise.fs, seconds = 20000.0, 2.0t = np.arange(int(fs * seconds)) / fsimpacts = np.zeros_like(t)for k in range(int(seconds * bpfo)):    impacts[round(k / bpfo * fs)] = 1.0 + 0.35 * np.cos(        2.0 * np.pi * shaft * k / bpfo)tau = np.arange(int(0.004 * fs)) / fsring = np.exp(-tau / 6.0e-4) * np.sin(2.0 * np.pi * 3000.0 * tau)x = np.convolve(impacts, ring)[: t.size] * 0.6x += 0.35 * np.sin(2.0 * np.pi * shaft * t)          # residual unbalancex += signals.noise_signal(fs, duration_s=seconds, color="white", rms=0.25, seed=17)
# Band-pass the resonance the impacts ring, envelope it, transform it,# and let the result draw its own lines on top.spectrum = signals.envelope_spectrum(x, fs, band=(2000.0, 4000.0))faults.within(1.0, 5.0 * bpfo).plot(spectrum=spectrum)plt.show()
Symbols on this page
Section titled “Symbols on this page”Norton keeps the notation of his sources, and one letter carries four different meanings across the four sections. The table below is the key; the one to watch is , which is a speed in section 1 and a count in sections 2 and 4.
| Symbol | Meaning | Unit | Section |
|---|---|---|---|
| shaft speed (the API’s first positional argument) | r/min | 1 | |
| shaft rotational frequency, | Hz | all | |
| number of rolling elements in the bearing | — | 1 | |
| , | rolling-element diameter, pitch diameter | same unit for both | 1 |
| contact angle, from the radial plane | degrees | 1 | |
| the shared factor | — | 1 | |
| number of gear teeth on the wheel (Norton’s Eq. 8.3) | — | 2 | |
| , | rotor bars, magnetic poles (not pole pairs) | — | 3 |
| , | slip (a fraction, not a percentage), supply frequency | dimensionless, Hz | 3 |
| , | number of rotor blades, number of stator vanes | — | 4 |
| number of pumping events per revolution | — | 4 | |
| harmonic index (rotor-slot in section 3, blade in section 4) | — | 3, 4 | |
| number of lobes of a rotating interaction pattern | — | 4 |
Nothing in the library reuses the name: bearing_fault_frequencies,
gear_mesh_frequencies and blade_pass_frequencies all take the shaft speed
in r/min first and the count second, so the collision lives in the printed
formulae only. It is still worth checking, because a count substituted for a
speed is a factor-of-60 error that raises no exception.
1. Rolling-contact bearings
Section titled “1. Rolling-contact bearings”Norton reproduces the eleven equations collected by Shahan and Kamperman
(Eqs. 8.4 to 8.14). They collapse to seven distinct frequencies, because
four of the eleven are the rotating-inner-race counterparts of rows already in
the table: either pairwise identical to them or reached through the
rotating_race argument. With the shaft speed in r/min, rolling
elements of diameter on a pitch diameter , a contact angle ,
and writing and :
| Name | Meaning | Expression | Norton eq. |
|---|---|---|---|
shaft |
shaft rotational frequency | (8.4) | |
FTF |
cage (fundamental train) frequency | (8.5) | |
FTF_rel |
cage relative to the rotating race | (8.11) | |
BSF |
rolling-element rotational frequency | (8.7) | |
BDF |
rolling-element spin frequency | (8.10) | |
BPFO |
element pass frequency, outer race | (8.8) | |
BPFI |
element pass frequency, inner race | (8.9) |
Those three geometric quantities carry the whole family, and two of them are routinely mistaken. The pitch diameter is measured between the rolling-element centres, not across the bore and not across the outside diameter. The contact angle is measured from the radial plane, so it does not appear in an end view at all: it is zero for a deep-groove ball bearing and non-zero for angular-contact and tapered-roller types, which is the only reason has a cosine in it.
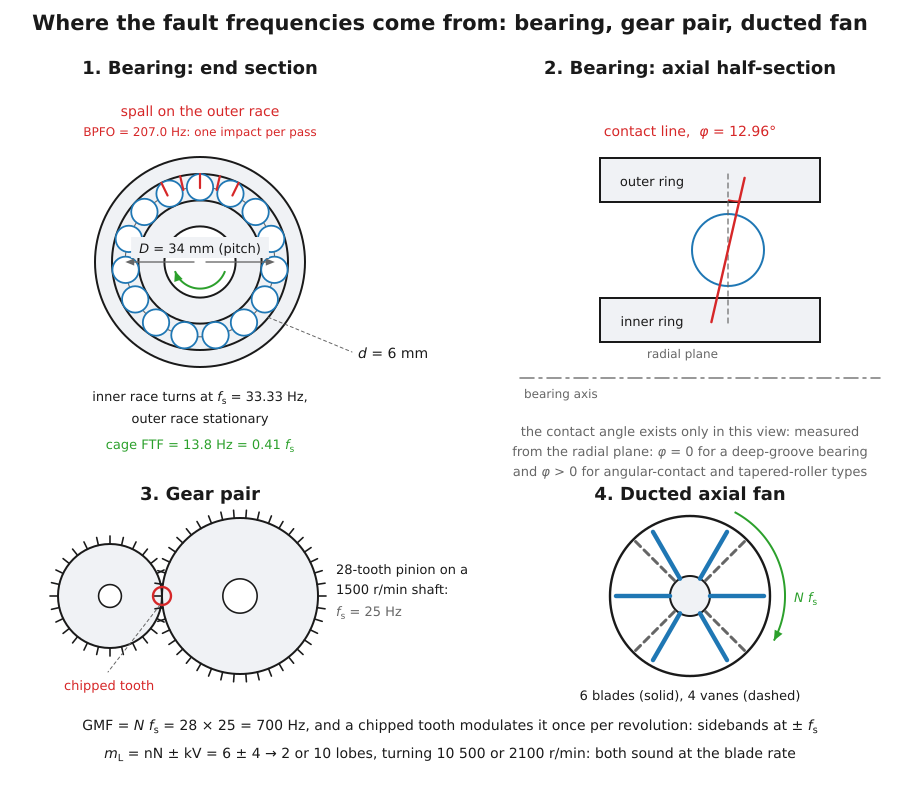
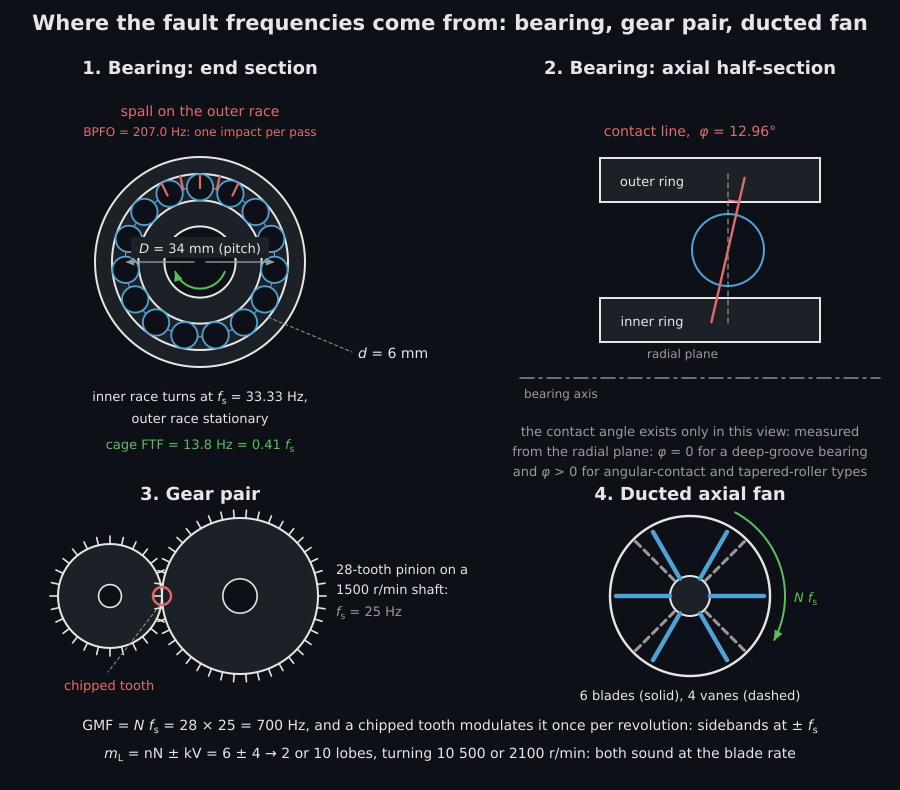
The two exact identities the section leans on are geometric statements this picture makes obvious: every element passes either the outer-race defect or the inner-race one, so ; and with a stationary outer race the cage carries all elements past the defect once per cage revolution, so .
Three of them carry the diagnosis: BPFO for an outer-race defect, BPFI for
an inner-race defect, and BDF for a damaged rolling element or cage. The two
rolling-element rows are one factor of two apart because they answer different
questions: BSF is how fast a roller turns, BDF how often a defect on it
strikes a race: twice per roller revolution, once against each. Evidence of a
damaged roller is therefore expected at BDF (183.3 Hz for the bearing above),
usually modulated at the cage rate FTF, while the line the figure draws at
91.7 Hz is the roller’s rotational rate BSF. Two
identities are worth remembering because they are exact and catch data-entry
errors instantly: always, and
whenever the outer race is stationary.
Presence and absence is the weak form of the diagnosis, and it works here only because this bearing’s BPFO (207 Hz) and BPFI (293 Hz) are far apart and the record is clean. The strong form is the modulation, and it follows from the same geometry:
- an outer-race defect sits at a fixed angular position in the load zone, so under a load of fixed direction every rolling element strikes it under the same load. The impact train is unmodulated, and BPFO appears as a clean harmonic series with little or no sideband structure. A load that turns with the shaft, from unbalance or misalignment, does modulate it once per revolution: the record of the opening figure carries one, which is where its small line at 33.3 Hz and the low pair at beside each BPFO harmonic come from;
- an inner-race defect turns with the shaft, so it passes in and out of the load zone once per revolution. The impact train is amplitude-modulated at the shaft rate, and BPFI carries sidebands around the line and around every harmonic (often more visible than the carrier itself);
- a rolling-element defect strikes the two races alternately while
travelling round with the cage, so it is modulated at the cage rate: BDF
carries sidebands. That is what
FTFandFTF_relare in the table for.
Norton states the inner-race case in Section 8.3.5: discrete faults along the inner race “rotate in and out of the loaded zone, generating the amplitude modulation”. Randall and Antoni (2011, Sections 1 and 6) give the three together, and the exception the opening figure shows: “For unidirectional load, an outer race fault would not be modulated, but modulation at shaft speed can occur because of significant unbalance or misalignment forces”. The animation plays the three one after another on the bearing of this page, 50 times slower than the machine, and scales every impact by the load at the angle where it lands.
End view of the bearing of this page, fifteen rollers between a fixed outer race and an inner race turning with the shaft, with the load zone shaded as a lobe over the top half of the outer ring, beside three traces of impacts against machine time from 0 to 150 milliseconds. First a spall on the outer race, fixed at the middle of the load zone: every roller that passes strikes it alike, and the first trace fills with equal bursts 4.83 milliseconds apart under a flat dashed load line. Then a spall on the inner race, which turns with the shaft: it strikes hard while it crosses the load zone and not at all on the far side, so the second trace shows groups of bursts 3.41 milliseconds apart that swell and vanish once per shaft turn, every 30.0 milliseconds. Last a spall on one roller, which rides round with the cage and strikes the outer and the inner race in turn: the third trace shows groups of bursts 5.46 milliseconds apart that swell once per cage turn, every 72.5 milliseconds.
End view of the bearing of this page, fifteen rollers between a fixed outer race and an inner race turning with the shaft, with the load zone shaded as a lobe over the top half of the outer ring, beside three traces of impacts against machine time from 0 to 150 milliseconds. First a spall on the outer race, fixed at the middle of the load zone: every roller that passes strikes it alike, and the first trace fills with equal bursts 4.83 milliseconds apart under a flat dashed load line. Then a spall on the inner race, which turns with the shaft: it strikes hard while it crosses the load zone and not at all on the far side, so the second trace shows groups of bursts 3.41 milliseconds apart that swell and vanish once per shaft turn, every 30.0 milliseconds. Last a spall on one roller, which rides round with the cage and strikes the outer and the inner race in turn: the third trace shows groups of bursts 5.46 milliseconds apart that swell once per cage turn, every 72.5 milliseconds.
The rates are those of bearing_fault_frequencies for this bearing. The load
zone is a sketch: the Stribeck distribution of McFadden and Smith (1984,
Eq. 3) for a roller bearing, drawn at the half circle, ,
that a bearing with clearance stays inside, because the clearance and the load
of this one are not known.
The sideband spacing is therefore the tie-breaker whenever two predicted families fall close together, and it is the same argument the gear-sideband paragraph of section 2 makes for a different component. Resolving a sideband costs record length, which is why the acquisition of section 5 matters here and not only in principle.
from phonometry import vibration
res = vibration.bearing_fault_frequencies(2000.0, 15, 6.0, 34.0, contact_angle_deg=12.96)print(round(res["BPFO"], 1), round(res["BPFI"], 1))   # 207.0 293.0print(round(res["BPFO"] + res["BPFI"], 1))            # 500.0 = 15 x 33.33print(res.as_dict())
Only the ratio enters, so the two diameters may be given in millimetres,
inches or metres as long as both use the same unit. rotating_race="outer"
moves the cage to Eq. (8.6); BPFO and BPFI do not move, because Norton’s
Eqs. (8.8) and (8.14), and (8.9) and (8.13), are pairwise identical.
These are the kinematics of a pure rolling contact. A real bearing under load slips a little, so the measured lines wander by one or two per cent from the prediction; that is normal and is why the overlay is read as “the peak is on the line”, not “the peak is at the line”.
The speed is the whole prediction
Section titled “The speed is the whole prediction”Every frequency on this page is strictly proportional to : the
seven bearing lines, the gear mesh and its sidebands, the motor’s 1x, 2x
and rotor-slot family, the blade-passing lines. A speed error therefore
propagates one-for-one into every predicted line, and the shaft speed is the
one input the arithmetic cannot check.
- Where it comes from. Not the nameplate: that is the synchronous or
full-load speed, and a loaded induction machine runs below it. The value
wanted here is the running speed at the moment of the record: from a
tachometer, a shaft encoder, a once-per-revolution optical or magnetic
pickup, or from the measured
1xpeak in the spectrum itself. The last is the usual field practice and is circular unless it is done deliberately: find the1xpeak first, then place everything else from it. - What drift does. If the speed wanders during the record, every predicted line smears in proportion to its order. A 1 % variation smears (828 Hz for the bearing above) by about 8 Hz, which is enough to merge a harmonic with its neighbours and destroy the evidence the overlay looks for. The opening figure of this page depends on four BPFO harmonics standing separately, so it depends on a steady speed.
- What to do about it. Order tracking, or a tacho-resampled time synchronous average, resamples the record onto shaft angle and puts the smeared orders back into single lines.
Tacho error and bearing slip are different faults and behave differently. A wrong speed shifts every line coherently and by the same fraction; slip shifts only the bearing lines, by one or two per cent, and not deterministically, which is also why bearing evidence survives synchronous averaging when gear evidence does not.
2. Gears
Section titled “2. Gears”The gear-meshing (tooth-passing) frequency of a wheel with teeth is (Eq. 8.3), with integer harmonics. What distinguishes the fault types is the sideband family around each harmonic: a single chipped tooth or an eccentric wheel modulates the mesh once per revolution and produces low, flat sidebands spaced by the shaft rate, while distributed wear raises tall sideband groups and lifts the higher mesh harmonics.
from phonometry import vibration
# A 28-tooth pinion on a 1500 r/min shaft, with two sideband orders.res = vibration.gear_mesh_frequencies(1500.0, 28, n_harmonics=3, n_sidebands=2)print(round(res["GMF"], 1))            # 700.0print(round(res["GMF+1x"], 1))         # 725.0  (GMF + one shaft order)print(res.harmonics("GMF", 3))         # [ 700. 1400. 2100.]
Pass sideband_rate to modulate at the mating wheel’s shaft rate instead,
which is what a fault on the other wheel of the pair produces. The first two
panels of the figure at the end of section 4 draw the two signatures side by
side, so the claim above is one to check by looking rather than to take on
trust.
3. Induction motors
Section titled “3. Induction motors”Three lines are always present in a motor vibration signal measured at the
bearing housing: 1x (mechanical unbalance), 2x (misalignment with the
driven load) and 2fe (a non-uniform air gap, torque pulses and the winding
and rotor-bar electrical faults). They are properties of the machine, not of
the bearing. Rotor defects that produce static or dynamic air-gap eccentricity
are read on the rotor-slot harmonics of Eq. (8.20),
for rotor bars, magnetic poles (not pole pairs), slip (a dimensionless fraction, near zero on a lightly loaded machine) and . Dynamic eccentricity dresses the dominant slot harmonic with sidebands at the shaft rate and the slip frequency.
from phonometry import vibration
# Sixty rotor bars, six magnetic poles, 3600 r/min, no slip: a six-pole# machine at that speed is running on a 180 Hz inverter drive, not on mains.res = vibration.induction_motor_frequencies(3600.0, 6, 60, slip=0.0)print(round(res["fe"]))                         # 180  the supply it impliesprint(round(res["1x"]), round(res["2x"]),      round(res["2fe"]), round(res["fsh"]))     # 60 120 360 3600
Read the supply frequency before the fault lines. 2fe follows the supply,
not the mains, so on a variable-frequency drive it moves with the drive
setting: the 360 Hz above is twice 180 Hz, and a six-pole machine on a 50 Hz
mains would run near 1000 r/min with 2fe at 100 Hz instead. The printed
fsh = 3600 Hz is the check the paragraph below is arguing for: at zero slip
Eq. (8.20) must reduce to the physical rotor-bar passing rate
Hz.
Give the slip directly, or give the mains supply_frequency and let the slip
follow from it and the measured shaft speed. The supply frequency is taken as
; Norton’s Eq. (8.19) writes ,
which is the same expression at zero slip but does not reduce Eq. (8.20) to
the physical rotor-bar passing rate when the machine is loaded.
Under load the result also carries the slip frequency and the pole-pass
line , the
sideband spacing that a broken rotor bar puts around 1x. The third panel of
the figure at the end of section 4 draws this family on a logarithmic amplitude
axis, which is the only way to see 1x and the rotor-slot harmonic in the same
picture: they are three decades apart.
4. Fans, blowers and pumps
Section titled “4. Fans, blowers and pumps”The blade-passing frequency of an impeller with blades is (Eq. 8.15). A pump’s hydraulic pulsations follow the same form, with the blade count replaced by the number of pumping events per revolution (Eq. 8.18). And a rotary positive-displacement blower repeats four times per revolution, which is handled by passing with a single “blade”:
from phonometry import vibration
# A rotary positive-displacement blower at 1200 r/min: four pulsations per# revolution, so the pulsation rate is asked for as 4 x r/min with N = 1.res = vibration.blade_pass_frequencies(4 * 1200.0, 1, n_harmonics=3)print(round(res["BPF"], 1))        # 80.0 Hz, the pulsation rateprint(round(res.shaft_rate, 1))    # 80.0 Hz - NOT the shaft rate, which is 20
The trick costs the shaft line: shaft_rate comes back at , so read the
shaft rate from a separate call at the true speed (or from
bearing_fault_frequencies) before combining families with
combine_fault_lines, or a 4th shaft harmonic will be plotted as if it were
bearing evidence.
In a ducted axial fan the blades also interact with the stator vanes and set
up rotating pressure patterns with lobes for vanes
(Eq. 8.16), turning at (Eq. 8.17), a
speed Norton writes in r/min. That is a speed of rotation, not a tone of its
own: Norton puts the noise of these patterns “also at the blade passing
frequency and its associated harmonics”, and the arithmetic says why, since
lobes turning times a second pass a fixed point
times a second. What sets the patterns apart is the lobe count,
and that is what a duct sees: a pattern can set up a higher-order duct mode with
the same pressure distribution, and the faster it turns, the more sound power
it radiates, which is why the choice of and matters. So the library
keeps the patterns out of the lines. Give n_vanes and the result, a
BladePassResult, holds the shaft and blade lines as any other family does and
the patterns apart in lobe_patterns, one LobePattern for each blade
harmonic and each signed : its n_lobes is and its speed_rpm
is . .plot() draws only the lines, and combine_fault_lines merges
only the lines.
# Six blades, four vanes, 3500 r/min (blade_pass_frequencies imported above).res = vibration.blade_pass_frequencies(3500.0, 6, n_harmonics=1, n_vanes=4)print(round(res.shaft_rate, 1)) # 58.3 Hz, the shaft itselfprint(round(res["BPF"])) # 350print(res.names) # ('shaft', 'BPF'), the lines alonefor pattern in res.lobe_patterns: print(pattern.n_lobes, round(pattern.speed_rpm), round(pattern.speed_rpm / 60))# 2 10500 175# 10 2100 35Those two numbers are the principle, worked. Both patterns come from the same blade harmonic on the same fan; the only difference is the sign of in . The pattern turns 10 500 times a minute, 175 times a second, three times the shaft speed, and the pattern 35 times a second, below it. : both sound at the blade rate, and neither puts a line of its own at 175 Hz or 35 Hz in a spectrum, which is why neither is a line of the result. By Norton’s rule the faster pattern is the stronger radiator. Six blades against four vanes is a design decision, and this is what it decides.
The sign of is kept, because it is the sense in which the pattern turns. With more vanes than blades, gives a negative lobe count, and Eq. (8.17) a negative speed: the pattern turns against the rotor. Four blades and six vanes at 600 r/min give , turning at r/min, beside at 240 r/min with the rotor:
res = vibration.blade_pass_frequencies(600.0, 4, n_harmonics=1, n_vanes=6)print([(p.vane_order, p.n_lobes, round(p.speed_rpm)) for p in res.lobe_patterns])# [(-1, -2, -1200), (1, 10, 240)]The animation turns both patterns on the fan of this page and counts what a point on the duct wall sees.
Two end views of the fan of this page, six blades turning in front of four dashed stator vanes inside a duct, each with a ring drawn around the rotor. On the left the ring has two lobes and turns 175 times a second; on the right it has ten lobes and turns 35 times a second, both the way the rotor turns. A dot marks one point on the duct wall and flashes each time a lobe crest passes it, with a counter under each view; at 40 milliseconds both read 14. Under the views, two traces write the shape of each pattern at that point against machine time from 0 to 40 milliseconds, with a tick each time a blade passes the point: the two traces are shifted against each other but repeat with the same period, 2.86 milliseconds, the spacing of the blade ticks, marked once as 1/BPF.
Two end views of the fan of this page, six blades turning in front of four dashed stator vanes inside a duct, each with a ring drawn around the rotor. On the left the ring has two lobes and turns 175 times a second; on the right it has ten lobes and turns 35 times a second, both the way the rotor turns. A dot marks one point on the duct wall and flashes each time a lobe crest passes it, with a counter under each view; at 40 milliseconds both read 14. Under the views, two traces write the shape of each pattern at that point against machine time from 0 to 40 milliseconds, with a tick each time a blade passes the point: the two traces are shifted against each other but repeat with the same period, 2.86 milliseconds, the spacing of the blade ticks, marked once as 1/BPF.
The speeds are those of blade_pass_frequencies for this fan, slowed 500
times. The rings are a sketch of a lobe count and a speed of rotation, not of
a pressure field, and the clip says nothing about how strongly either pattern
radiates.
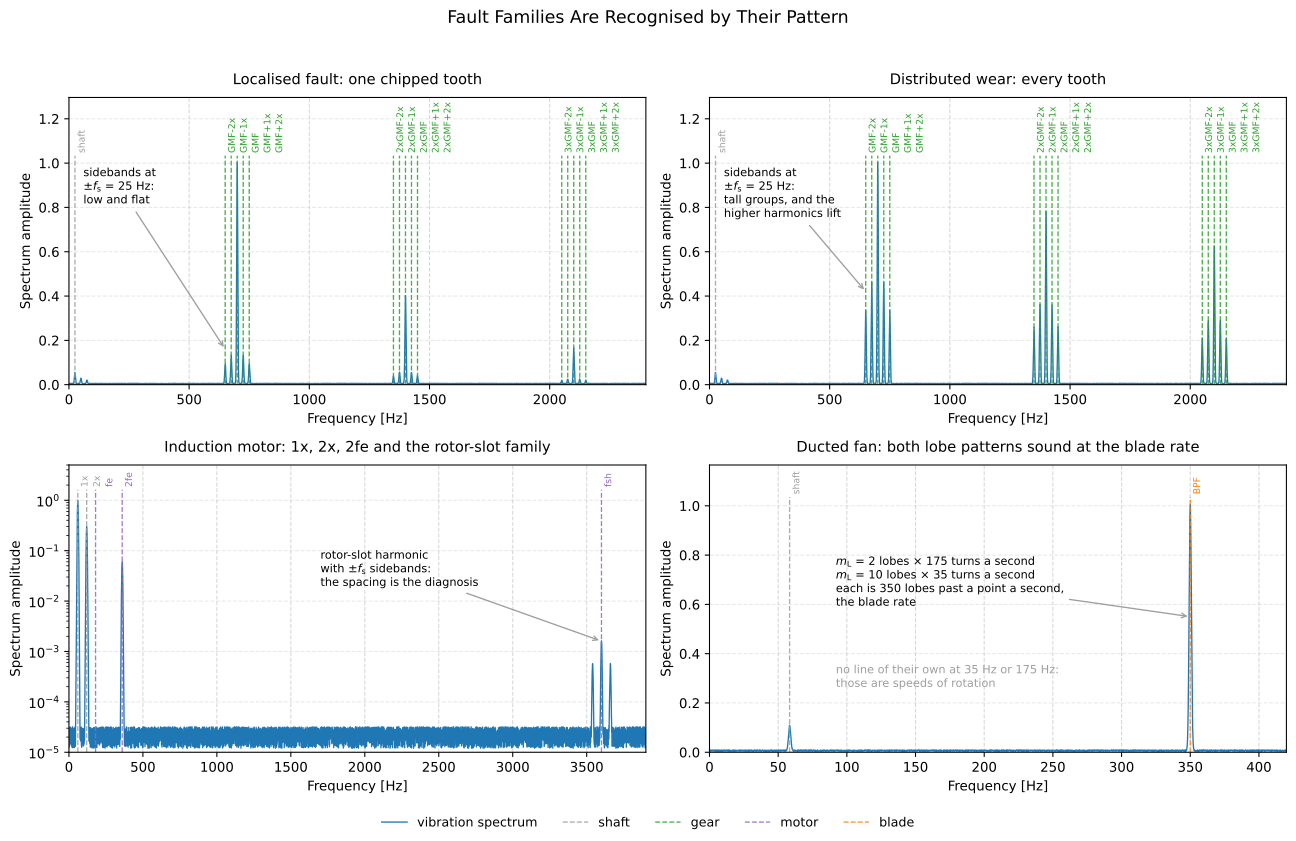
A fault family is recognised by its pattern, not by a single number. The two
gear panels are the same 28-tooth pinion at 1500 r/min with two different
faults: a chipped tooth gives low, flat sidebands at and harmonics
that fall away; distributed wear gives tall sideband groups and lifts the
higher harmonics. The motor panel spans three decades of amplitude, which is
why the rotor-slot harmonic and its sidebands need a logarithmic
axis to be visible at all beside 1x. The fan panel has no line for either
lobe pattern: both sound at the blade rate they come from.
Show the code for this figure
import matplotlib.pyplot as pltimport numpy as np
# The library predicts the lines; the spectra under them are synthesised at# exactly those frequencies, so the figure and the printed values agree.gear = vibration.gear_mesh_frequencies(1500.0, 28, n_harmonics=3, n_sidebands=2)freq = np.linspace(0.0, 2400.0, 4800)amp = np.full_like(freq, 0.004)for order, height in enumerate((1.0, 0.40, 0.16), start=1):    for centre, level in (        (order * gear["GMF"], height),        (order * gear["GMF"] - gear.shaft_rate, 0.13 * height),        (order * gear["GMF"] + gear.shaft_rate, 0.13 * height),    ):        amp += level * np.exp(-0.5 * ((freq - centre) / 2.2) ** 2)
spectrum = type("S", (), {"frequencies": freq, "amplitude": amp})()gear.within(1.0, 2400.0).plot(spectrum=spectrum)plt.show()
5. From a raw record to a named line
Section titled “5. From a raw record to a named line”The kinematics answer where to look; the signal chain answers what is there. Before either, something has to record the machine, and envelope analysis is unusually sensitive to how that is done.
Step 0. Getting the record
Section titled “Step 0. Getting the record”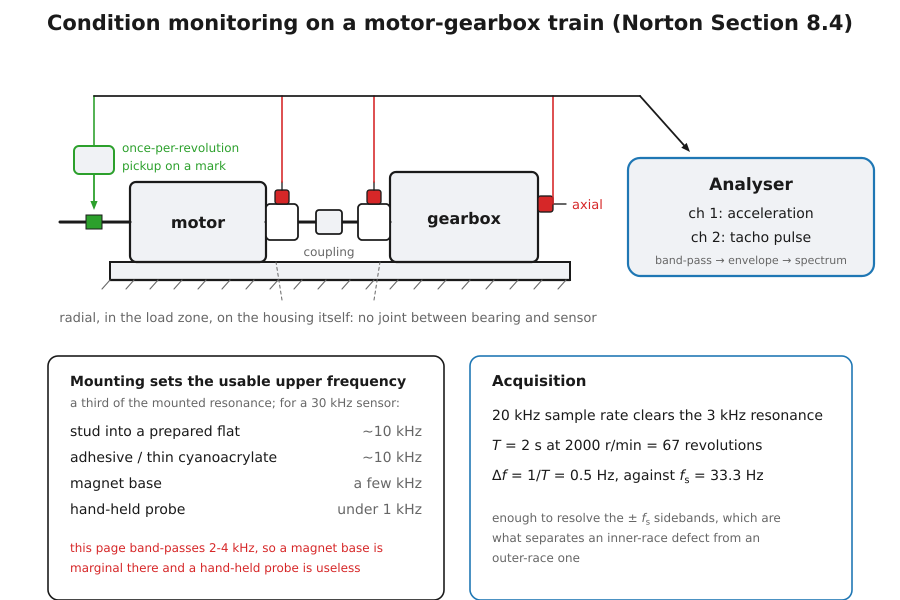
Where the transducer goes. On the bearing housing, in the load zone, as close to the outer race as the geometry allows and with the shortest possible structural path to it. A measurement taken across a bolted joint, on a guard or on sheet metal loses the high-frequency impact energy the whole method rests on. Radial and axial positions answer different questions: radial (horizontal, or vertical where the load direction demands it) for the bearing and unbalance families, axial for misalignment and for helical or bevel gear meshes.
How it is mounted. The mounting resonance sets the usable upper frequency, and this method needs kilohertz. The reading stays within about 1 dB up to a third of the accelerometer’s resonance (ISO/TS 7849-1, 5.2), which on the machine is the mounted one. On a stud into a prepared flat a general-purpose accelerometer resonates near 30 kHz and is good to about 10 kHz; an adhesive or thin cyanoacrylate bond costs little of that; a magnet base leaves a few kilohertz (about 6 kHz in Norton & Karczub, Section 4.3.2, while ISO/TS 7849-1, Annex A, accepts one only below 2.5 kHz, on smooth flat steel); a hand-held probe resonates near 2 kHz and stays under 1 kHz (the resonances are those of the characteristic curves of ISO 5348:1998, Figures 5 to 9). The band used below is 2-4 kHz, which a magnet base is marginal at and a hand probe cannot reach: this is the single most common reason an envelope analysis finds nothing on a bearing that is in fact spalled.
What to acquire. The sample rate must clear the ringing resonance with margin: 20 kHz for a 3 kHz housing resonance leaves the band-pass and the detector room to work. The record must contain enough revolutions for the envelope spectrum to resolve the shaft rate, because the resolution the reader gets is and the sideband spacing to be resolved is itself. Two seconds at 2000 r/min is 67 revolutions and 0.5 Hz of resolution against a 33 Hz shaft rate, which is why the shaft line and the sidebands of section 1 are separable at all. Record longer if the speed is low or the sidebands are the diagnosis; record shorter only if the speed will not hold still (see The speed is the whole prediction above).
Which transducer. An ordinary piezoelectric accelerometer covers the kilohertz bands used here. An acoustic-emission or dedicated high-frequency sensor moves the useful band up by an order of magnitude, which changes the band step 1 should isolate; if the machine is instrumented that way, find the resonance before choosing it.
The three signal-processing steps
Section titled “The three signal-processing steps”For a bearing the classical route has three steps, and the library has one function for each:
- Isolate the resonance the impacts ring. A spall excites a
high-frequency structural resonance of the housing, far above the shaft
harmonics and the gear mesh. Pass its band as
band=(low, high)toenvelope_spectrum, which band-passes the record with a zero-phase filter before the detector so the modulation phase is untouched. Choosing that band is the only judgement in the chain: look at the raw spectrum for the broadband hump the impacts excite, tap the housing and watch what rings, or scan band centre and width for the band whose envelope is most impulsive (the kurtogram). The band must sit above the shaft harmonics, the gear mesh and its sidebands and any electrical line, or those tones survive the band-pass and appear as their own lines in the envelope spectrum, where a mesh peak is easily misread as a bearing harmonic. It must be wide enough to pass the impact ringing without truncating it and narrow enough that the noise floor does not swamp it. The 2-4 kHz used on this page is chosen because these impacts ring a 3 kHz housing resonance. - Detect and transform the envelope. The repetition rate of the impacts is an amplitude modulation of that resonance, so it becomes a line in the envelope spectrum, at the fault frequency and its harmonics. See the cepstrum and envelope-spectrum guide.
- Name the lines. Overlay the kinematic prediction.
.plot(spectrum=…)accepts anyenvelope_spectrumresult (or anything exposingfrequenciesandamplitude) and draws the predicted lines over it, coloured by family so shaft harmonics never read as bearing evidence.
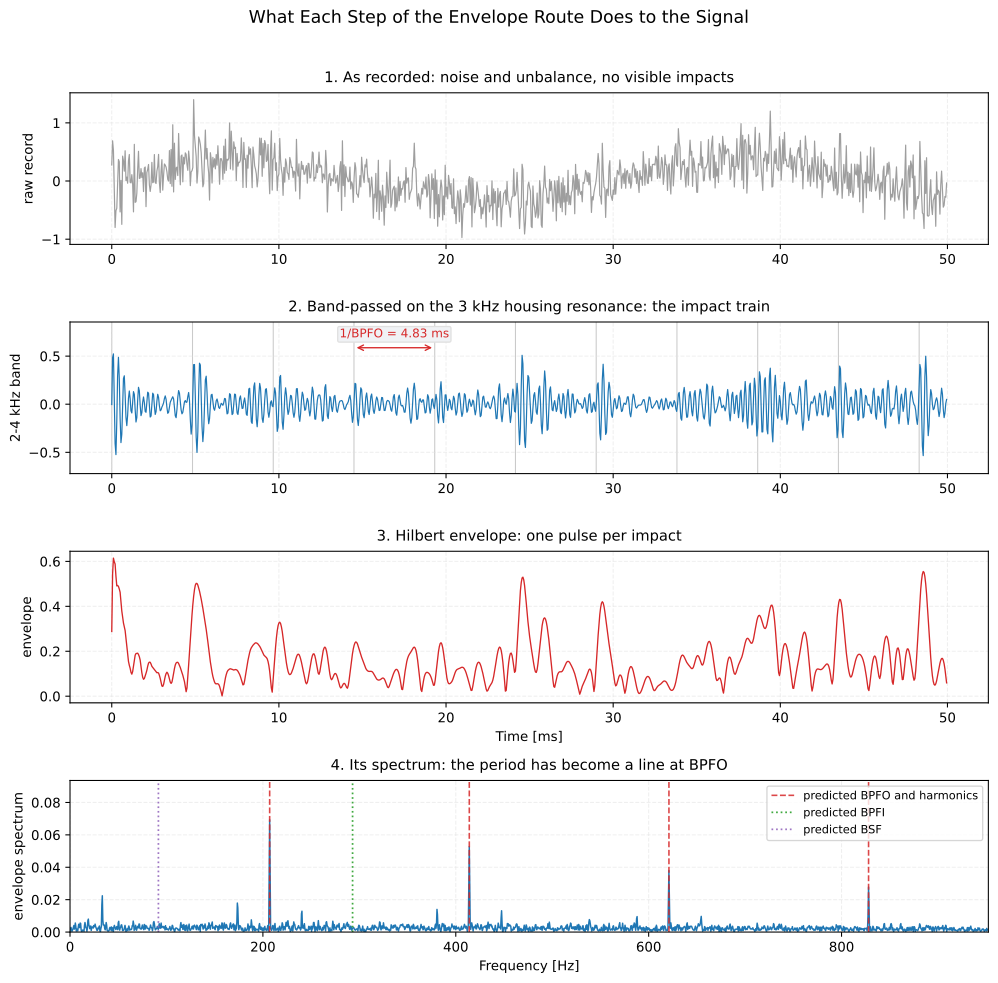
The three steps made visible on one record. The impacts are invisible in the raw signal, obvious once the 2-4 kHz band is isolated, rectified into a pulse train by the envelope detector, and finally read as a line at 207 Hz and its harmonics: the period of panel 2 becoming the frequency of panel 4.
Show the code for this figure
import matplotlib.pyplot as pltfrom scipy import signal as sp_signal
# The record x, its sample rate fs, its time base t and the predicted BPFO# are the ones built for the opening figure.band = (2000.0, 4000.0)spec = signals.envelope_spectrum(x, fs, band=band)     # carries .envelope and .times
# The same zero-phase 4th-order Butterworth band-pass the call applies# internally, run here so the intermediate record can be drawn.sos = sp_signal.butter(4, band, btype="bandpass", fs=fs, output="sos")narrow = sp_signal.sosfiltfilt(sos, x)
fig, axes = plt.subplots(4, 1, figsize=(10, 10))window = slice(0, int(0.05 * fs))                       # the first 50 msaxes[0].plot(t[window], x[window]); axes[0].set_ylabel("raw a")axes[1].plot(t[window], narrow[window]); axes[1].set_ylabel("2-4 kHz")axes[2].plot(spec.times[window], spec.envelope[window])axes[2].set_ylabel("envelope"); axes[2].set_xlabel("Time [s]")keep = spec.frequencies <= 4.6 * bpfoaxes[3].plot(spec.frequencies[keep], spec.amplitude[keep])for order in range(1, 5):    axes[3].axvline(order * bpfo, ls="--", color="C1")axes[3].set_xlabel("Frequency [Hz]"); axes[3].set_ylabel("envelope spectrum")plt.show()
Two more tools help when the record is crowded. Time synchronous averaging removes everything not locked to one shaft, which separates a gearbox’s two shafts before the sidebands are read; and the cepstrum collapses a whole harmonic or sideband family onto a single quefrency spike, which is the fastest way to tell which periodicity dominates when several are superimposed.
Put the two together on one machine. The record below is the one the figures on this page are drawn from: two seconds at 20 kHz from a stud-mounted accelerometer on the bearing housing, radial and in the load zone, with the shaft speed taken from the once-per-revolution pickup at the same moment. The bearing supports a 28-tooth pinion, so the housing carries three families at once.
from phonometry import signals, vibration
record, fs = x, 20000.0          # the housing record and its sample rateshaft_rpm = 2000.0               # from the tacho, not from the nameplate
# The bearing's own lines, the mesh family of the pinion it supports, and the# shaft harmonics. Put them all on one axes.bearing = vibration.bearing_fault_frequencies(shaft_rpm, 15, 6.0, 34.0,                                              contact_angle_deg=12.96)gear = vibration.gear_mesh_frequencies(shaft_rpm, 28, n_harmonics=2, n_sidebands=1)lines = vibration.combine_fault_lines(bearing, gear)
spectrum = signals.envelope_spectrum(record, fs, band=(2000.0, 4000.0))lines.within(1.0, 1600.0).plot(spectrum=spectrum)
within(low, high) trims the family to the span the analysis actually covers,
which matters because the highest mesh harmonic here (2xGMF+1x, 1900 Hz) is
above the useful part of this envelope spectrum.
Covered and not covered
Section titled “Covered and not covered”Covered
The kinematic families of Norton Section 8.4: rolling-contact bearings (Eqs. 8.4 to 8.14), gear mesh and sidebands (Eq. 8.3), induction-motor supply, slip, pole-pass and rotor-slot lines (Eqs. 8.19 and 8.20), and blade-passing frequencies with the lobed interaction patterns of a ducted axial fan (Eqs. 8.15 to 8.18), through
bearing_fault_frequencies,gear_mesh_frequencies,induction_motor_frequencies,blade_pass_frequencies,combine_fault_linesandshaft_rate.Not covered
These are predictions, not detections: nothing here decides whether a line is present, only where it would be. The amplitude criteria that turn a present line into a severity assessment (crest factor and kurtosis trends, ISO 10816 / ISO 20816 velocity severity bands) are outside this module; Norton’s own guidance is qualitative (crest factors of 2.5 to 3.5 for a healthy bearing, up to about 11 with impulsive defects; kurtosis near 3 healthy and above 4 damaged). The pole-pass frequency is standard condition-monitoring practice rather than Norton’s: he gives the slip frequency itself as the broken-bar sideband spacing and does not multiply it by the pole count.
References
Section titled “References”- International Organization for Standardization. (1998). Mechanical vibration and shock — Mechanical mounting of accelerometers (ISO 5348:1998). The characteristic responses of Figures 5 to 9 behind the mounting bands of the opening drawing: the resonance of a typical accelerometer on a stud, on adhesive, on a magnet and on a hand-held probe. The edition read is its unchanged German adoption DIN ISO 5348:1999-07; since revised as ISO 5348:2021 (https://www.iso.org/standard/78160.html).
- International Organization for Standardization. (2009). Acoustics — Determination of airborne sound power levels emitted by machinery using vibration measurement — Part 1: Survey method using a fixed radiation factor (ISO/TS 7849-1:2009). The rule that sets the usable upper frequency of an accelerometer at one third of its resonance, for 1 dB (5.2), and the limits Annex A.1 gives for adhesive, wax and clamping magnets.
- McFadden, P. D., & Smith, J. D. (1984). Model for the vibration produced by a single point defect in a rolling element bearing. Journal of Sound and Vibration, 96(1), 69-82. https://doi.org/10.1016/0022-460X(84)90595-9 Section 2.2 gives the Stribeck distribution of the load round a bearing under radial load (Eqs. 3 and 4), with its exponent of 3/2 for ball and 10/9 for roller bearings, which the animation of the load zone on this page draws.
- Norton, M. P., & Karczub, D. G. (2003). Fundamentals of noise and vibration analysis for engineers (2nd ed.). Cambridge University Press. https://doi.org/10.1017/CBO9781139163927 Section 8.4 collects the discrete fault frequencies of rotating machinery implemented on this page: the eleven rolling-contact bearing frequencies after Shahan and Kamperman (Eqs. 8.4-8.14), the gear-meshing frequency (Eq. 8.3), the blade-passing frequency and the lobed interaction patterns of a ducted axial fan (Eqs. 8.15-8.17), the pump hydraulic pulsation frequency (Eq. 8.18) and the induction-motor supply and rotor-slot harmonic frequencies (Eqs. 8.19-8.20). ISBN 978-0-521-49913-2.
- Randall, R. B., & Antoni, J. (2011). Rolling element bearing diagnostics—A tutorial. Mechanical Systems and Signal Processing, 25, 485-520. https://doi.org/10.1016/j.ymssp.2010.07.017 Sections 1 and 6 state what the load zone does to the impact train of each localised fault: modulated at shaft speed for an inner-race fault and at cage speed for a rolling-element fault, unmodulated for an outer-race fault under a load of fixed direction, and modulated at shaft speed when unbalance or misalignment turns the load.