Getting Started
phonometry is a Python toolkit for acoustic measurement, from fractional
octave filter banks and frequency weighting to sound levels and standardized
metrics. Every metric is verified against its governing standard: 1899
numerical checks in all. Install it with pip install phonometry; the first
example below filters a signal into one-third-octave bands and returns the
sound pressure level of each band, and the section after it anchors those
levels to a calibrator tone, which is what turns them into a measurement.
Installation
Section titled “Installation”The commands below are pip’s. Environments takes uv, conda, Jupyter, JupyterLite, Docker and type checkers in turn.
From PyPI (recommended)
Section titled “From PyPI (recommended)”pip install phonometryIf phonometry 3.x is already installed, upgrade it with
pip install -U phonometry, naming the extras you use
(pip install -U "phonometry[full]" for all four where [full] installs);
3.x has a different import layout and from phonometry import filters fails
on it. Code written for 3.x needs changes to run on 4.x; the
upgrade guide maps each of them.
phonometry needs Python 3.12 or newer, with NumPy 2.0.2 and SciPy 1.14.0
or later. Each of those floors, and each floor of the extras, is the oldest
release the library’s tests pass with, and a CI job installs exactly those
releases on Python 3.12 to keep it so: matplotlib 3.10.7 for [plot],
reportlab 4.3.0 and svglib 0.9.1 (but not 1.4.0) for [report], numba
0.60.0 for [perf], python-soundfile 0.12.0 for [audio] and torch 2.3.0
with array-api-compat 1.5.1 for [torch]. Python 3.13 and 3.14 have floors
of their own for NumPy, SciPy, numba and torch, whose oldest releases have no
wheel for them: the oldest releases that do, which the same job installs on
each, on Python 3.13 NumPy 2.1.0, SciPy 1.14.1, numba 0.61.0 and torch 2.5.0,
and on Python 3.14 NumPy 2.3.2, SciPy 1.16.1, numba 0.63.0 and torch 2.9.0.
The Python 3.13 wheel of torch 2.5.0 is for Linux on x86-64 only, where the
job runs; on macOS on ARM, Windows on x86-64 and Linux on ARM the first is
torch 2.6.0, the oldest that installs there.
Windows on ARM, Linux with musl, macOS on Intel and 32-bit Windows have no
wheel at some of those floors, and pip held to them builds those releases from
source there, which takes compilers. On Windows on ARM the first wheels are
NumPy 2.3.0, SciPy 1.16.2 and numba 0.68.0 (0.67.0 on Python 3.14), so every
floor of the three but NumPy’s on Python 3.14 is built. On Linux with musl, as
in Alpine, the first SciPy wheel on ARM for Python 3.12 and 3.13 is 1.15.2,
matplotlib publishes no wheel for musl on ARM at all, so [plot] builds it
there, and numba, with the llvmlite it needs, publishes no musl wheel at all,
so [perf] builds from source on any musl system. On macOS on Intel numba
publishes no wheel from 0.63.0 on, nor llvmlite from 0.46.0 on, and numba no
longer tests that platform, which it leaves to community support, so [perf]
builds both at the floor of Python 3.14; their last wheels there, numba 0.62.1
and llvmlite 0.45.1, are for Python 3.12 and 3.13. On 32-bit Windows NumPy has
a wheel at every floor, but the last SciPy wheel there is 1.9.1, for Python
3.9 at most, so even a plain install builds SciPy there on every Python, and
SciPy’s own build warns there to install a 64-bit Python. matplotlib has
published no 32-bit Windows wheel since 3.8.0, nor kiwisolver, which it needs,
since 1.4.8, so [plot] builds both there. numba stopped supporting 32-bit
Windows at 0.58.0, below the floor of [perf], and its last wheels there,
numba 0.57.1 and llvmlite 0.41.1, are for Python 3.10 at most, so [perf] is
not supported there, nor [full], which holds it;
pip install "phonometry[plot,report,audio]" installs the other three extras
there. The same holds on 32-bit Linux, where numba’s last wheels, of 0.56.4,
are for Python 3.10 at most and numba supports the platform no longer; Docker
and servers says what the other three
build there. A plain install takes the newest releases, which have wheels on
the other three platforms but numba’s on musl and on macOS on Intel, where a
plain [perf] install builds numba and llvmlite on every Python, and
matplotlib’s on ARM with musl. PyPI has no torch wheel for any of the four,
the last for macOS on Intel being 2.2.2, older than every floor, and none ever
for 32-bit Windows, and torch publishes no source distribution, so [torch]
does not install on them from PyPI. On Windows on ARM PyTorch’s CPU index has
torch wheels for Python 3.12, from 2.7.0, and 3.13, from 2.8.0, so installing
torch from it first, as below, brings [torch] there; it has none for Python
3.14 there, none for Linux with musl or 32-bit Windows, and for macOS on Intel
none after 2.2.2, as on PyPI. python-soundfile, for [audio], publishes no
wheel that carries libsndfile for Linux with musl, nor at its floor 0.12.0 for
Linux on ARM, whose first is 0.13.0, or for Windows on ARM, whose first is
0.14.0, so pip installs its pure-Python wheel there, which loads the system’s
libsndfile: on Alpine apk add libsndfile-dev, since the Python of the
official Docker image finds that library only under the name libsndfile.so,
which that package adds.
Optional extras
Section titled “Optional extras”pip install "phonometry[plot]" # matplotlib, for filter response plots and result .plot() methodspip install "phonometry[perf]" # numba, faster 'impulse' time weightingpip install "phonometry[report]" # reportlab + svglib, so result .report() methods render normative PDF fiches (their figure panel needs [plot] too)pip install "phonometry[audio]" # python-soundfile, so phonometry.io also reads FLAC, AIFF, Ogg/Opus, MP3 and compressed WAVpip install "phonometry[full]" # all of the above (recommended)pip install "phonometry[torch]" # torch + array-api-compat, so the FDTD engines run on PyTorch (CPU, CUDA or Apple MPS); not part of [full]I recommend pip install "phonometry[full]": it brings matplotlib, numba,
reportlab, svglib and soundfile in one go, so every feature of the library is
enabled except the torch backend of the FDTD engines, which [torch] adds. On
32-bit Windows and 32-bit Linux, which [full] does not support,
pip install "phonometry[plot,report,audio]" brings the other three, as
above, and builds from source SciPy, matplotlib and kiwisolver on Windows, and
NumPy, SciPy, matplotlib and Pillow among others on Linux. The
base install computes every metric on NumPy and SciPy alone, including reading
every linear measurement WAV (24-bit, multichannel EXTENSIBLE, RF64) through
phonometry.io; the only things it leaves unavailable are the figures
(.plot() and the filter response plots), the normative PDF fiches
(.report()), the compiled kernel that speeds up the impulse time weighting,
the other audio formats (FLAC, AIFF, Ogg/Opus, MP3 and compressed WAV), and the
torch backend of the FDTD engines (which run on NumPy either way, and on an
NVIDIA GPU once CuPy is installed). One licensing note on [audio]: it
installs python-soundfile, whose wheel bundles libsndfile under the
LGPL-2.1 (dynamically linked, the same pattern as librosa and torchaudio),
and which loads the system’s libsndfile where no wheel carries one, as above.
The base install deliberately stays free of it, which is why the metrological
formats need no extra.
One caveat about [full]: numba is the only extra that caps NumPy, and it
raises that cap only once it supports a new NumPy minor. So in the weeks after
a NumPy minor release, phonometry[full] (like phonometry[perf]) can resolve
one minor behind what a plain install gets. numba only makes the impulse time
weighting faster, so if you need the newest NumPy the day it ships, install
phonometry[plot,report] and leave [perf] out.
numba keeps the compiled kernel on disk, beside the package or under your home
directory, so a later process loads it instead of compiling it again. Where
neither is writable, as for a service account or a container user with no home,
it compiles the kernel once in each process instead; point NUMBA_CACHE_DIR at
a writable directory to keep it.
[full] leaves [torch] out on purpose: the torch wheels PyPI serves on
Linux bring gigabytes of CUDA libraries. On a Linux machine without an NVIDIA
GPU, install torch from PyTorch’s CPU index first, then the extra, which keeps
the torch it finds, and those libraries stay out; on Windows on ARM, where
PyPI has no torch, the same two commands bring [torch] on Python 3.12 and
3.13:
pip install torch --index-url https://download.pytorch.org/whl/cpupip install "phonometry[torch]"Adding that index with --extra-index-url is not enough: pip takes the
newest torch it finds on either index, PyPI’s CUDA build included.
Where a simulation runs says what each device of the FDTD engines needs, CuPy’s wheel for an NVIDIA GPU among them, and pip and uv what each extra brings and how uv installs them.
From a clone
Section titled “From a clone”git clone https://github.com/jmrplens/phonometry.gitcd phonometrypip install .pip builds the wheel without a compiler; pip and uv has the rest.
As a git submodule
Section titled “As a git submodule”git submodule add https://github.com/jmrplens/phonometry.git# Then install in editable mode to use it from your projectpip install -e ./phonometryThe processing chain at a glance
Section titled “The processing chain at a glance”Every phonometry analysis is some subset of one pipeline: take the raw signal, convert it to physical units, weight it in frequency, split it into standardized bands, smooth it in time and reduce it to metrics:
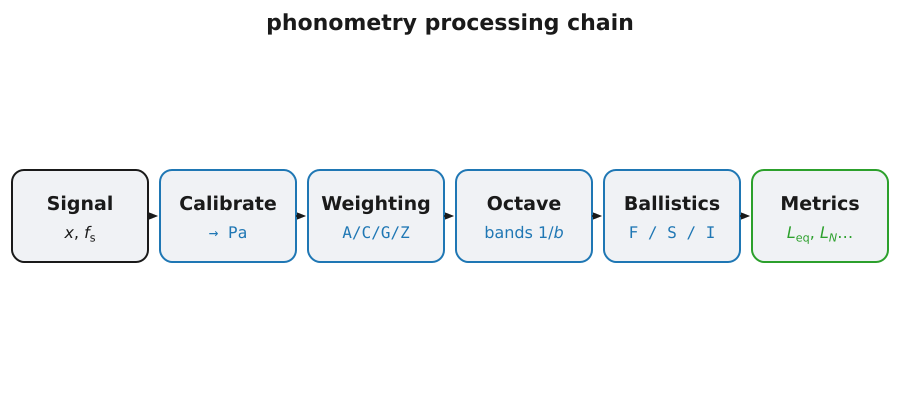
Read it as a sequence of decisions rather than a fixed recipe. Calibration comes first because everything downstream is a ratio to 20 µPa, so a wrong scale factor shifts every later number by the same amount and nothing further along can detect it. Frequency weighting is defined by IEC 61672-1 as one filter applied to the broadband signal; applying band-by-band weighting corrections after the bank instead is a shortcut that only holds for a stationary signal. The bank decides the frequency resolution, and the ballistics and the metrics decide the time behaviour, both acting on the weighted signal, in that order, because exponential time weighting squares the signal and so does not commute with anything before it.
The example in the next section runs Signal → Octave and nothing else: no calibration, so its levels are pascals by assumption rather than by measurement; no weighting, so they are Z (unweighted); no ballistics, so each band is one r.m.s. value over the whole record. “Give the samples physical meaning” below puts the first stage back, and each stage is an independent function or class you can use on its own; the guides cover them left to right (Calibration → Frequency Weighting → Filter Banks → Time Weighting → Levels).
A first analysis: one-third-octave bands (uncalibrated)
Section titled “A first analysis: one-third-octave bands (uncalibrated)”Split a signal into one-third-octave bands and read the level of each one.
import numpy as npfrom phonometry import filters
fs = 48000t = np.linspace(0, 1, fs, endpoint=False)# Composite signal: 100Hz + 1000Hzsignal = np.sin(2 * np.pi * 100 * t) + np.sin(2 * np.pi * 1000 * t)
# Apply 1/3 octave filter bankresult = filters.octave_filter(signal, fs=fs, fraction=3)
print(f"Bands: {result.frequencies}")# Bands: [12.589254117941678, 15.848931924611138, ..., 19952.623149688785]  (33 bands)print(f"SPL [dB]: {result.levels}")# SPL [dB]: [46.77640002 47.81719048 48.93133762 ...]# the 100 Hz band reads 90.71 dB and the 1 kHz band 90.94 dB
The band frequencies come out as numbers, not as the labels on an analyser.
IEC 61260-1 places the midband frequencies on a base-10 grid,
with for one-third octaves, which is why
the lowest is 12.589 Hz and the highest 19952.6 Hz. The round numbers a
hand-held meter prints are the same standard’s nominal designations for the
same bands: pass nominal=True and freq comes back as ['12.5', '16', …, '20k'], which is what you want on an axis or in a report, while the exact
values are what you want when computing with them. There are 33 bands because
the default range is 12 Hz to 20 kHz; limits=[f_min, f_max] narrows it, and
narrowing it is usually worth doing; see Filter
Banks for the grid.
Read the spectrum before trusting it. Two of the 33 bands hold the signal: 90.71 dB at 100 Hz and 90.94 dB at 1 kHz, both within 0.3 dB of 90.97 dB, the level of a unit-amplitude sine read as pascals (). That agreement is the check that the bank is doing arithmetic you can defend; the small deficit at 100 Hz is the decimated band filter’s response at its own centre, not lost energy. Everything else on the plot is the filter bank looking at itself: 64.40 dB at 80 Hz and 62.43 dB at 125 Hz, and 56.91 dB at 800 Hz and 56.58 dB at 1.25 kHz, are the two tones leaking through the skirts of the adjacent filters, 26 to 34 dB down; the slow climb from 46.78 dB at 12.5 Hz to 55.15 dB at 50 Hz is the far stopband of those filters plus the numerical floor. The rule of thumb that follows: in a band spectrum, treat anything more than about 40 dB below the loudest band as an artefact of the analysis until a background measurement says otherwise. Filter Class Verification is the mask that fixes how far down those skirts must be.
These are not yet physical levels. octave_filter always returns
, and with the default
calibration it takes the numeric value of each sample to be the pressure in
pascals. A unit-amplitude sine is therefore read as 0.7071 Pa rms, which is
90.97 dB, exactly right for a synthetic signal defined in pascals, and exactly
wrong for a recording, whose sample values are whatever the converter and the
gain staging happened to produce. There are two honest ways to get a level you
can defend. Pass the pascals-per-digital-unit factor obtained from a calibrator
tone via calibration=filters.LevelCalibration(factor=S) (see
Calibration and dBFS), or, when
the signal never had a physical scale, ask for LevelCalibration(dbfs=True) and
read levels relative to digital full scale, which come out negative and cannot
be mistaken for an SPL.
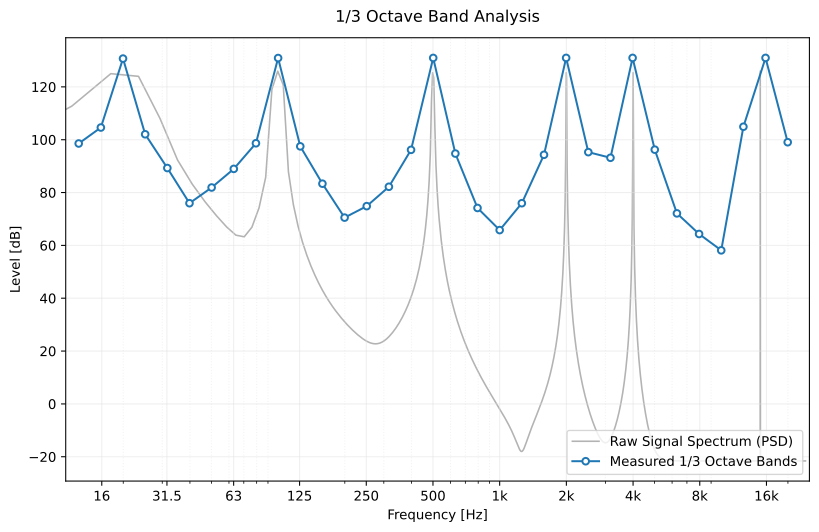
A richer example than the snippet above: six tones (20, 100, 500, 2000, 4000 and 15000 Hz) at amplitude 100, so the band levels run to about 131 dB. The grey curve is the raw-signal PSD, shifted down to share the axis.
Show the code for this figure
import matplotlib.pyplot as pltimport scipy.signalimport numpy as npfrom phonometry import filters
fs = 48000t = np.linspace(0, 5, 5 * fs, endpoint=False)# Six tones at amplitude 100, so the bands land around 130 dBtones = [20, 100, 500, 2000, 4000, 15000]y = 100 * np.sum([np.sin(2 * np.pi * f * t) for f in tones], axis=0)# Apply 1/3 octave filter bankfiltered = filters.octave_filter(y, fs=fs, fraction=3, limits=[12.0, 20000.0])spl, freq = filtered.levels, filtered.frequencies
# Gray background: the raw-signal PSD (Welch), shifted to sit just below the# band SPLs so both spectral shapes share one axis.f_psd, psd = scipy.signal.welch(y, fs, nperseg=8192)psd_db = 10 * np.log10(psd + 1e-12)psd_db += np.max(spl) - np.max(psd_db) - 5
fig, ax = plt.subplots()ax.semilogx(f_psd, psd_db, color="gray", alpha=0.6, label="Raw signal PSD")ax.semilogx(freq, spl, marker="o", markerfacecolor="white",            label="1/3 octave bands")ax.set_xlabel("Frequency [Hz]")ax.set_ylabel("SPL [dB]")ax.set_xlim(11, 25000)ax.legend(loc="lower right")plt.show()
The same call can also draw the bank it just designed, which is what the
[plot] extra is for: pass response_plot=filters.ResponsePlot(show=True) and
the 33 band filters appear on one axis before the levels come back.
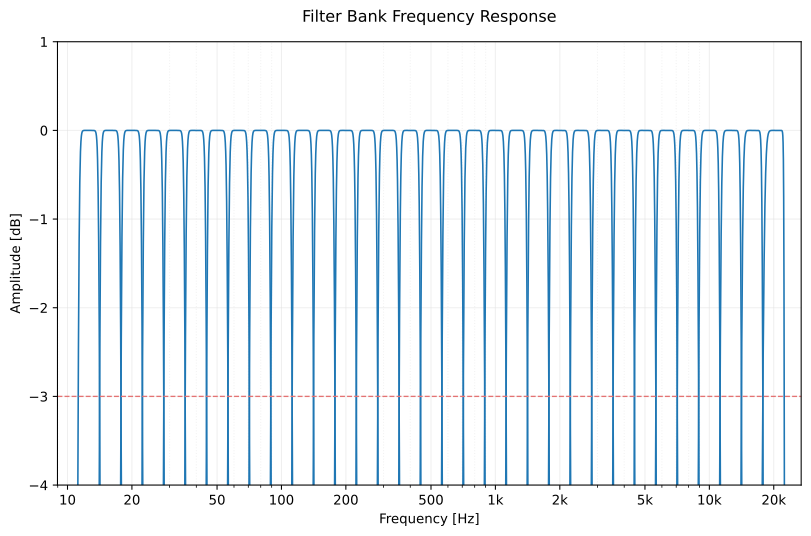

The default bank: Butterworth, order 6, one-third octave. Each curve crosses −3 dB at its own band edges, which is where the skirts of the previous paragraph come from, and the IEC 61260-1 class 1 mask is what fixes how fast they fall away.
Show the code for this figure
filtered = filters.octave_filter( signal, fs=fs, fraction=3, response_plot=filters.ResponsePlot(show=True))spl, freq = filtered.levels, filtered.frequenciesFilter Architecture Gallery has the same plate for the other four architectures.
Give the samples physical meaning
Section titled “Give the samples physical meaning”The levels above are not a measurement, because nothing connected the numbers in the array to a pressure. That connection is a single factor , the sensitivity in pascals per digital unit, and you obtain it by recording a calibrator of known level through the same microphone, preamplifier, interface and gain setting you are about to measure with. A class 1 acoustic calibrator produces 94 dB re 20 µPa at 1 kHz, which is Pa r.m.s., not 1 Pa, a 0.02 dB difference that is worth getting right because it propagates into every level afterwards.
# What the acquisition chain does to the pressure. This microphone, preamplifier# and interface together deliver 0.005 digital units per pascal; in a real# measurement you never know this number, which is exactly what the calibrator# is for.chain = 0.005
# What the calibrator writes to disk: 3 s of 1 kHz at 94 dB re 20 uPa.p94 = 2e-5 * 10 ** (94.0 / 20)                       # 1.0024 Pa RMScalibrator = chain * np.sqrt(2) * p94 * np.sin(    2 * np.pi * 1000 * np.arange(3 * fs) / fs)
# ...and the measurement: the same two tones through the same chain.recording = chain * signal
# The sensitivity is the known pressure over the RMS of the recorded tone.cal = p94 / np.sqrt(np.mean(calibrator ** 2))print(f"{cal:.1f} Pa per digital unit")# 200.0 Pa per digital unit
filtered = filters.octave_filter(    recording, fs=fs, fraction=3, nominal=True,    calibration=filters.LevelCalibration(factor=cal),)spl, bands = filtered.levels, filtered.frequenciesprint(f"{bands[9]} Hz: {spl[9]:.2f} dB SPL, {bands[19]}: {spl[19]:.2f} dB SPL")# 100 Hz: 90.71 dB SPL, 1k: 90.94 dB SPL
Two things are worth noticing. The calibrated levels are the same numbers as in the first analysis, because the synthetic signal there was defined in pascals and this recording is that same field seen through a chain the calibrator has now undone; but this time they are decibels re 20 µPa because a measurement put them there, not because we assumed it. And the same recording read without the factor gives 44.92 dB in the 1 kHz band, 46.0 dB low: an uncalibrated level is not approximately right, it is off by whatever the gain staging happened to be.
In practice you do not divide by hand. metrology.sensitivity(calibrator, target_spl=94.0, fs=fs) returns the same factor and, on the way, checks the
recorded tone’s short-term stability the way IEC 60942 qualifies the calibrator
itself, so a badly coupled microphone is caught here instead of silently
corrupting every level downstream. Calibration and
dBFS carries that call, the
pre/post drift rule and the digital dBFS alternative for signals that never had
a physical scale.
One number instead of thirty-three
Section titled “One number instead of thirty-three”A meter shows one level, not a spectrum. On a calibrated signal that level is one line, because the A weighting and the energy average are both defined on the broadband pressure:
weighted = filters.weighting_filter(cal * recording, fs, weighting="A")laeq = 10 * np.log10(np.mean(weighted ** 2) / (2e-5) ** 2)print(f"LAeq = {laeq:.2f} dB(A)")# LAeq = 91.02 dB(A)The unweighted level of the same second is 93.98 dB: A weighting takes almost
3 dB off, essentially all of it from the 100 Hz tone, which the curve attenuates
by about 19 dB. signals.laeq(recording, fs, calibration_factor=cal) is the
one-line form of the two lines above and applies the weighting internally, so
never A-weight the signal first and then pass it to a level function; that
weights it twice. The Fast and Slow envelopes, , and the
percentile levels are the same kind of call: Time
Weighting and Integrated and
Statistical Levels have them, and Build a
sound level meter runs the whole chain
from a calibrator tone to all of them on one page.
Read a sound level meter WAV
Section titled “Read a sound level meter WAV”The synthetic signal above stood in for a file. With a real meter you have
two WAVs (the calibrator take and the measurement), and phonometry.io
reads both as measurements: native rate kept, integer PCM scaled exactly to
full scale, channels first, nothing normalized. The Signal it returns
carries the sample rate and, once you attach it, the calibration, so the
level functions stop asking you to repeat either:
import numpy as npfrom phonometry import io, metrology, signals
# Both files come from the meter, in this order, through one untouched chain.cal_take = io.read("calibrator.wav")          # the 94 dB calibrator tonecal = metrology.sensitivity(np.asarray(cal_take), target_spl=94.0,                            fs=cal_take.fs)
sig = io.read("measurement.wav", calibration_factor=cal)print(f"Leq = {float(signals.leq(sig)):.1f} dB")   # no fs, no factor to repeat
The base install reads everything a meter writes: 24-bit PCM, multichannel
EXTENSIBLE, overnight RF64. It warns if the file is a compressed listening
copy rather than a linear recording. Write the factor into the sidecar once
(io.write_sidecar("measurement.wav", cal)) and from then on
io.read("measurement.wav") comes back calibrated with no arguments at
all. Reading and writing measurement audio
is the full workflow: provenance, streaming, BWF writing and lossless
conversion.
Analyzing an audio file
Section titled “Analyzing an audio file”A real measurement is two recordings, not one, and the conditions under which they are made decide what the levels are worth:
- Same chain, nothing touched in between. Record the calibrator tone first, then the measurement, through the same microphone, preamplifier, interface and gain. Lock the gain before the calibrator tone and never move it again: the factor is only valid while the chain stays as it was calibrated, and a touched gain knob is a larger error than any drift.
- Keep peaks 10–12 dB below full scale, and switch off everything automatic. Automatic gain control, noise suppression, limiting and interface EQ all change the level as a function of the level, so a processed sample can no longer be turned into a sound pressure level. A clipped one cannot either.
- Record at 48 kHz or more. At 44.1 kHz the bands above are dropped:
the bank returns 32 bands ending at 15848.9 Hz instead of the 33 ending at
19952.6 Hz shown above. It trims its default span so without a word; limits
you give that reach past are trimmed the same way, and a
filters.FilterBankWarningnames the bands left out. - Repeat the calibrator check at the end. The pre/post difference is the drift bound for everything captured in between, and a common criterion invalidates the series when it exceeds 0.5 dB.
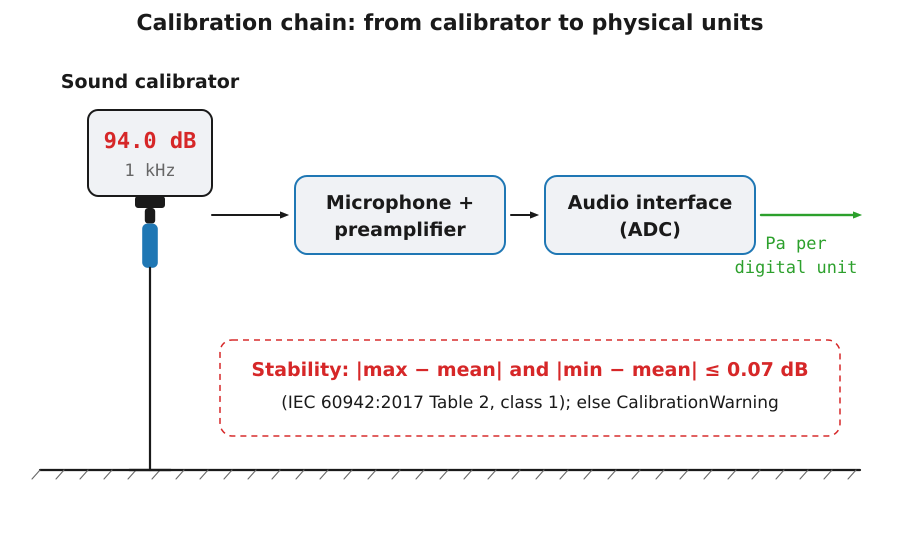
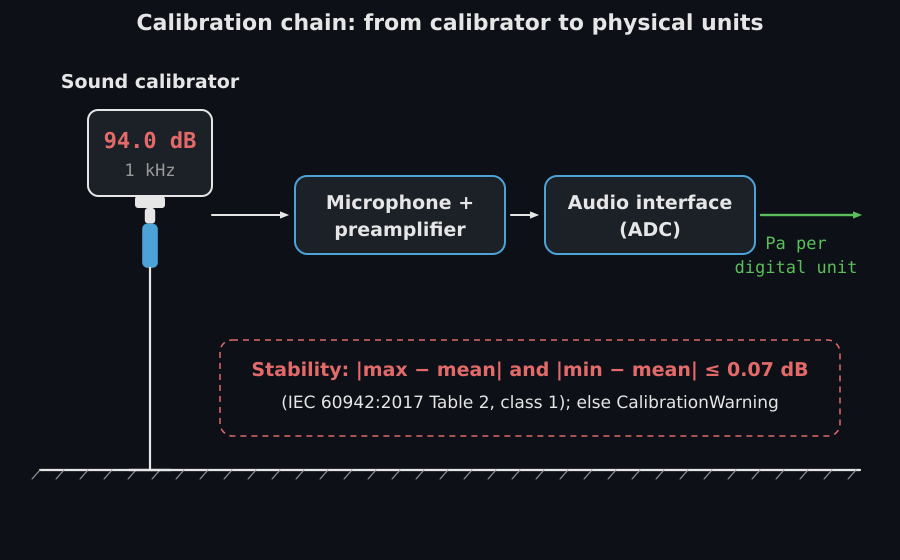
The first of the two recordings: the calibrator coupled onto the capsule at 94.0 dB / 1 kHz, through the same preamplifier and interface as the measurement that follows, producing the pascals-per-digital-unit factor everything downstream depends on.
import numpy as npfrom scipy.io import wavfilefrom phonometry import filters
# Both files come from the same chain, in this order, with nothing touched.fs, calibrator = wavfile.read("calibrator.wav")fs, signal = wavfile.read("measurement.wav")
# wavfile.read returns (samples, channels); the bank expects (channels, samples)if calibrator.ndim > 1:    calibrator = calibrator[:, 0]if signal.ndim > 1:    signal = signal[:, 0]        # measurement microphone on channel 1
# Sensitivity in pascals per digital unit, from the 94 dB calibrator tone.# metrology.sensitivity(calibrator, target_spl=94.0, fs=fs) is the library call,# and it validates the tone's stability as well.cal = 2e-5 * 10 ** (94.0 / 20) / np.sqrt(np.mean(calibrator.astype(float) ** 2))
filtered = filters.octave_filter(    signal, fs=fs, fraction=3, nominal=True,    calibration=filters.LevelCalibration(factor=cal),)spl, freq = filtered.levels, filtered.frequencies
The two mechanical pitfalls below belong to this raw-scipy route. io.read
in the previous section removes both, scaling integer samples to full scale
and returning channels first, but they are worth knowing whenever a bare
array enters the library:
Reduce a multichannel file to the channel you measured with, or transpose it.
The guard above is not decoration: wavfile.read returns a (samples, channels) array, and the bank reads a 2D array as (channels, samples). Pass a
stereo file as it comes and nothing raises. A 2400-sample stereo array returns
an spl of shape (2400, 33), one spectrum per pair of samples, and a
one-second file takes minutes to produce meaningless numbers. See
Multichannel and Performance for
the convention, and for the case where several calibrated channels are analysed
at once, each with its own sensitivity.
Integer audio is cast, not rescaled. wavfile.read output runs without an
error because integers are converted to float64 internally, but an int16 sample
of +32767 enters the bank as 32767.0 rather than 1.0. Every level therefore
comes out dB above the same signal read as float.
For example, a unit-amplitude 1 kHz sine peaks at 90.94 dB and the same sine
written to int16 peaks at 181.25 dB. Divide by the full-scale value
(signal / 32768.0 for int16) before analysing, or let the calibration step
absorb it: a sensitivity determined from a calibrator recording in the same
integer format already carries the factor. Mixing the two (a float-read
calibrator and an integer-read measurement, or the reverse) is wrong by 90 dB
with no symptom. The rules are in
Calibration and dBFS.
One number per band, over the whole file. octave_filter returns a single
r.m.s. level per band for the entire array, with the mean removed first
(detrend=True); it answers “how much energy was in each band during this
recording”, which is the right question for a steady source and the wrong one
for anything that changes. A pass-by, a machine that cycles or a room that
someone walks through comes back as an energy average nobody asked for. If the
level moves during the record, slice the signal and call the bank per slice, or
take the standard route and use the exponential Fast/Slow ballistics that a
sound level meter shows; mode="peak" gives the band peak instead of the
average, and a band peak is not . There is a floor on the other side
too: a band filter needs several cycles of its own centre frequency to settle,
so a one-second record says very little about the 12.5 or 16 Hz bands however
many digits come back.
In a notebook
Section titled “In a notebook”Jupyter and JupyterLab display the value of the last line of a
cell, and a result displays as a table of its fields: each with its unit when
its name carries one (_db, _hz, _m…), names a level or a level
difference (insertion_loss and band_levels are in decibels) or is an axis
the API names by the bare concept (frequencies in hertz, levels in decibels, times in
seconds), each array as one line with its shape and the range of its values,
never the values themselves, so the frames of a simulation take a single row. A verdict shows its outcome, PASS or FAIL,
in the title. Showing the table reads the fields and, on a verdict, passes,
which may read other properties of the verdict; it draws nothing and runs
nothing else. print() and repr() are unchanged: the dataclass repr, with
numpy’s own summary of an array longer than a thousand values.
This cell filters a 1 kHz tone over noise into one-third-octave bands and ends in the result:
import numpy as npfrom phonometry import building, filters
fs = 48000t = np.arange(fs) / fsrng = np.random.default_rng(7)noise = np.cumsum(rng.standard_normal(fs))noise /= np.std(noise)x = 0.4 * np.sin(2 * np.pi * 1000.0 * t) + 0.05 * noise
bank = filters.octave_filter(x, fs, fraction=3, limits=[20.0, 20000.0])bank        # the last line of the cell: the notebook shows its table
Jupyter shows it under the cell as this table:
| field | value | unit |
|---|---|---|
levels | array 31 float64, 17.125 to 82.986 | dB |
frequencies | tuple of 31 numbers, 19.953 to 19953 | Hz |
bands | None |
A verdict, in a cell of its own, shows its outcome in the title. This one applies Annex G.4 of ISO 10140-1 to a lining test on a masonry wall: the measurements without and with the lining may be a day apart only once the wall has cured for two weeks, or for at least three times that lag, and 2.9 days is neither:
check = building.check_lining_curing(curing_time_days=2.9, time_lag_days=1.0)check # a verdict: its outcome in the title| field | value | unit |
|---|---|---|
curing_time_days | 2.9 | d |
time_lag_days | 1 | d |
required_curing_days | 14 | d |
The IPython terminal prints the same tables as text:
OctaveFilterResult  levels       array 31 float64, 17.125 to 82.986    dB  frequencies  tuple of 31 numbers, 19.953 to 19953  Hz  bands        Noneplot()
LiningCuringCheck: FAIL  curing_time_days      2.9  d  time_lag_days         1    d  required_curing_days  14   dplot()
The last line names what the result can draw. .plot() returns the
matplotlib axes, and a notebook draws the figure under the cell with its
inline backend, with no plt.show(); in a script, call plt.show() or save
the figure:
ax = bank.plot() # drawn under the cell; in a script, plt.show()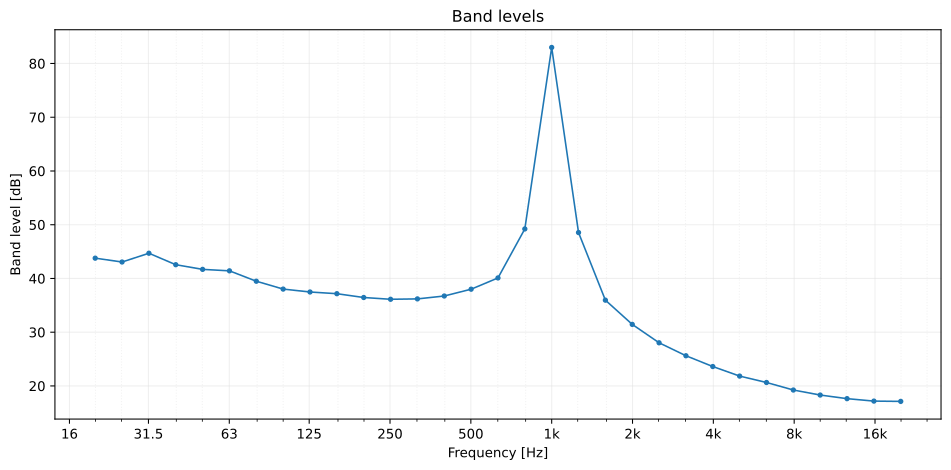
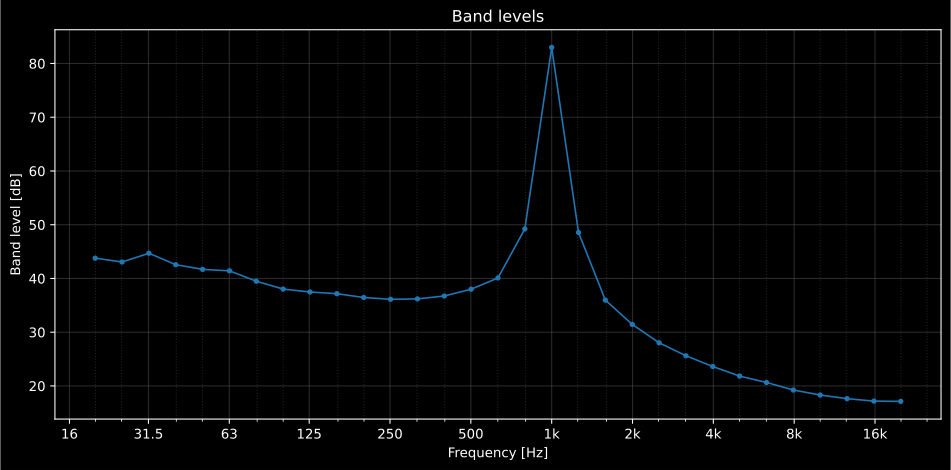
The figure bank.plot() draws under the cell: the one-third-octave spectrum
of the 1 kHz tone over noise.
Jupyter and JupyterLab carries on from here: SVG figures, videos, fiches and how a warning shows in a cell, and JupyterLite and Pyodide the same notebook in a browser.
Where to go next
Section titled “Where to go next”The octave analysis above uses phonometry.filters, one of twenty-one import
namespaces. The documentation groups them into thirteen areas, one per sidebar
topic, from psychoacoustics and room, building and vibration acoustics to
environmental, aircraft and underwater noise, electroacoustics and FDTD wave
simulation. Every result object exposes a one-line
.plot(language="en"|"es") figure and, where a standard defines a reporting
format, a .report() method that renders the normative PDF fiche.
- Build a sound level meter: the same chain run end to end, from the calibrator tone to , , , , the percentile levels and the class check of every stage
- All guides: the map, every guide grouped by topic with a line on each
- Glossary: a symbol, its unit, its defining clause and the guide that computes it
- Filter Architecture Gallery: choose an architecture and inspect responses
- Calibration and dBFS: get real-world SPL values
- Why phonometry: the conformance-first design philosophy
- Conformance report: the expected and computed value of all 1899 checks
- API Reference: every parameter of every function
- Bibliography: every work the guides cite, with the pages that cite it and its link where it has one