Advanced Loudness (ISO 532-2/-3, ECMA-418-2)
Standards: ISO 532 ECMA-418 Key references: Moore 2013
Verified by 10 conformance checks against ISO 532-2:2017, ISO 532-3:2023 and ECMA-418-2:2025: 10 in Psychoacoustics.
The Zwicker method of ISO 532-1 is the reference route to loudness in sones and lives in Loudness, together with the ISO 226 equal-loudness contours. This page covers the newer model families phonometry ships beside it: the Moore-Glasberg loudness of ISO 532-2/532-3 and the Sottek Hearing Model loudness of ECMA-418-2:2025, whose shared auditory front-end also powers the tonality and roughness metrics of Sound Quality Metrics.
The page opens with the choice: which model fits which measurement, and why the sone values of the four methods agree at the 1 kHz / 40 dB anchor yet are not interchangeable digit for digit. Each model then gets its own section with a worked example, its figure and its parameter table.
Choosing a loudness model
Section titled “Choosing a loudness model”| Model | Standard | Stationary / time-varying | Output | When to use |
|---|---|---|---|---|
| Zwicker | ISO 532-1:2017 | both | sone | Reference method; one-third-octave input; fast and widely cited |
| Moore-Glasberg | ISO 532-2:2017 | stationary | sone | roex excitation pattern; better for tones and explicit binaural summation |
| Moore-Glasberg-Schlittenlacher | ISO 532-3:2023 | time-varying | sone (STL/LTL) | Time-varying loudness with short-/long-term traces and the peak |
| Sottek (Hearing Model) | ECMA-418-2:2025 | time-varying | sone_HMS | Shares one auditory front-end with the ECMA tonality and roughness metrics |
All four methods are anchored so a 1 kHz tone at 40 dB SPL is ≈ 1 sone; the values are not interchangeable digit-for-digit because the models differ in their auditory filters and their loudness summation.
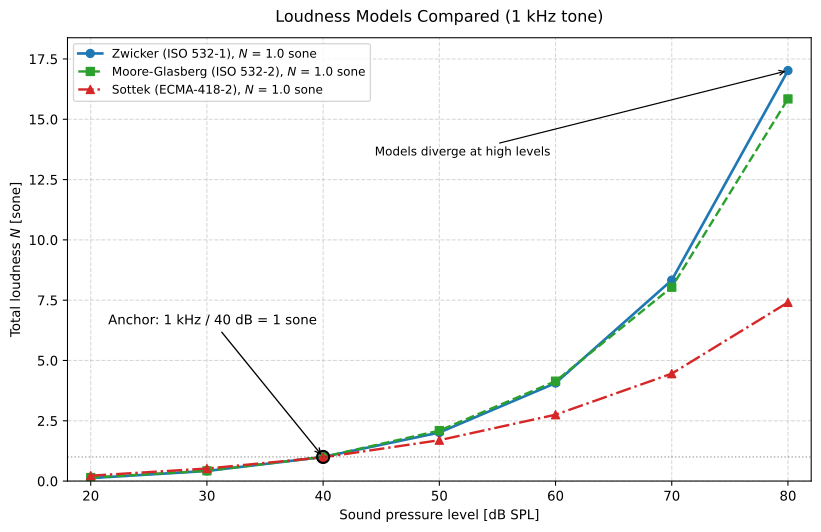
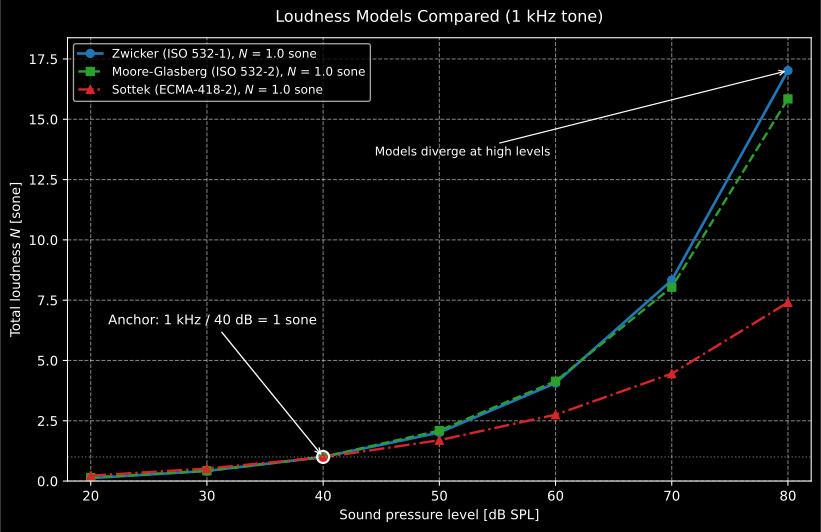
The three models pass through approximately 1 sone at the 40 dB anchor (the Sottek front-end returns 0.9845 sone_HMS there) and diverge with level: Zwicker doubles the sone value every +10 phon, while the Sottek model grows more slowly (about 1.65× per 10 dB), an intrinsic difference between the auditory summations, not a calibration error.
Show the code for this figure
import matplotlib.pyplot as pltimport numpy as npfrom phonometry import psychoacoustics
# 1 kHz tone, 20..80 dB SPL: all three models pass close to 1 sone at 40 dBfs = 48000t = np.arange(fs) / fslevels = np.arange(20.0, 81.0, 10.0)zw, mg, ec = [], [], []for spl in levels:    x = np.sqrt(2) * 2e-5 * 10 ** (spl / 20) * np.sin(2 * np.pi * 1000 * t)    zw.append(psychoacoustics.loudness_zwicker(x, fs, stationary=True).loudness)    mg.append(        psychoacoustics.loudness_moore_glasberg_from_spectrum([(1000.0, float(spl))]).loudness    )    ec.append(psychoacoustics.loudness_ecma(x, fs).loudness)
fig, ax = plt.subplots()ax.plot(levels, zw, "o-", label="Zwicker (ISO 532-1)")ax.plot(levels, mg, "s--", label="Moore-Glasberg (ISO 532-2)")ax.plot(levels, ec, "^-.", label="Sottek (ECMA-418-2)")ax.plot(40.0, 1.0, "o", color="k", markerfacecolor="none", markersize=10)   # the shared anchorax.set(xlabel="Sound pressure level [dB SPL]", ylabel="Total loudness N [sone]")ax.legend()plt.show()
The ERBN scale and the Cam axis
Section titled “The ERBN scale and the Cam axis”Every model on this page except Zwicker’s is written on the ERBN number axis, so it is worth having the scale itself in hand. The cochlea behaves as a bank of overlapping band-pass auditory filters; the width of the one centred on a given frequency is summarised by its equivalent rectangular bandwidth, the bandwidth of the rectangular filter that would pass the same power with the same peak response. Fitting notched-noise data for young listeners at moderate levels, Glasberg and Moore (1990) make it a straight line in frequency (Moore, An Introduction to the Psychology of Hearing 6e, p. 76):
Integrating turns that into a frequency scale on which one step is one auditory-filter width. The scale is the ERBN number and its unit is the Cam, after Cambridge:
from phonometry import psychoacoustics
cam = psychoacoustics.cam_from_frequency(1000.0)print(round(psychoacoustics.erb_bandwidth(1000.0), 1))       # 132.4 Hzprint(round(cam, 2))                                         # 15.59 Camprint(round(psychoacoustics.frequency_from_cam(cam), 1))     # 1000.0 Hz
The library states the same fit with one more significant digit,
and
, the precision the ISO 532-2 implementation
uses; the two forms agree to better than 0.2 % over the audible range, and the
extra digits are what make frequency_from_cam an exact inverse. These are not
private helpers of the loudness model: loudness_moore_glasberg calls the same
three functions, so a MooreGlasbergLoudness.erb_number grid and a Cam axis
you build yourself cannot drift apart.
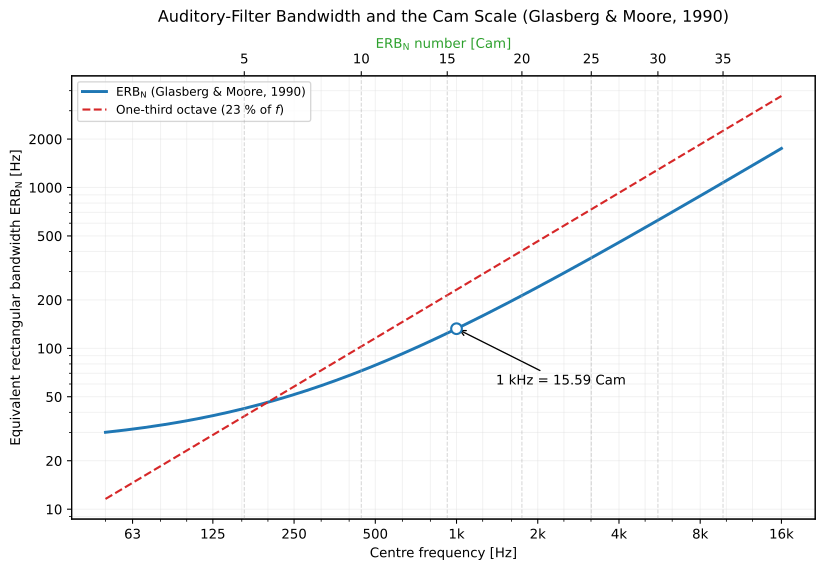
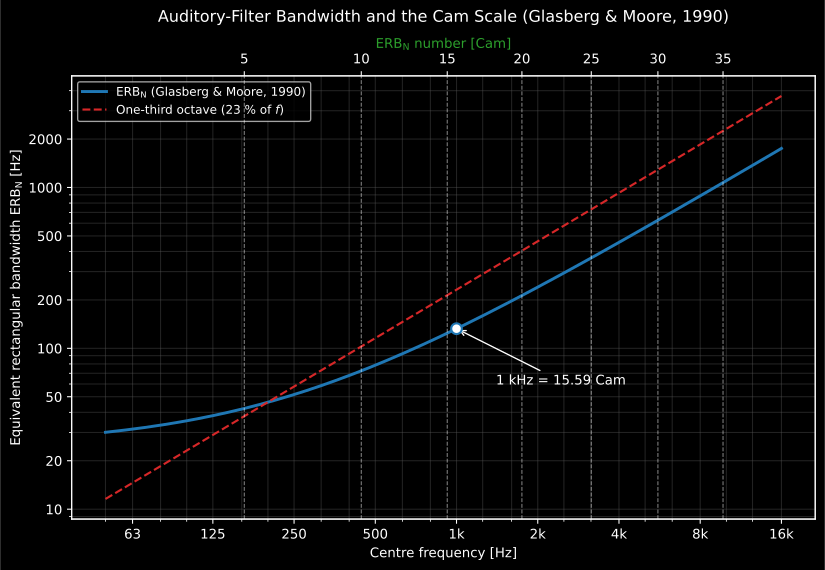
The ear’s filter is not a constant fraction of frequency. Below about 500 Hz it is markedly narrower than a one-third octave, which is why the “old” critical-band function, flat at low frequency, fits the direct measurements so poorly there; above that it is wider. The top axis counts the same curve in Cams, so equal steps along it are equal numbers of auditory filters.
Show the code for this figure
import matplotlib.pyplot as pltimport numpy as npfrom phonometry import psychoacoustics
f = np.geomspace(50.0, 16000.0, 400)erb = psychoacoustics.erb_bandwidth(f)third_octave = f * (2 ** (1 / 6) - 2 ** (-1 / 6))     # 23 % of f, for scale
fig, ax = plt.subplots()ax.loglog(f, erb, label="ERB$_N$ (Glasberg & Moore, 1990)")ax.loglog(f, third_octave, "--", label="One-third octave (23 % of f)")ax.set(xlabel="Centre frequency [Hz]",       ylabel="Equivalent rectangular bandwidth ERB$_N$ [Hz]")ax.legend()
# The Cam axis on top: tick where whole ERB_N numbers fall.cam_ticks = np.arange(5.0, 40.0, 5.0)ax2 = ax.twiny()ax2.set_xscale("log")ax2.set_xlim(ax.get_xlim())ax2.set_xticks(psychoacoustics.frequency_from_cam(cam_ticks))ax2.set_xticklabels([f"{c:.0f}" for c in cam_ticks])ax2.set_xlabel("ERB$_N$ number [Cam]")plt.show()erb_bandwidth(), cam_from_frequency(), frequency_from_cam() parameters
Section titled “erb_bandwidth(), cam_from_frequency(), frequency_from_cam() parameters”| Parameter | Type | Units | Range / default | Notes |
|---|---|---|---|---|
frequency |
float or array | Hz | ≥ 0 | erb_bandwidth, cam_from_frequency |
cam |
float or array | Cam | ≥ 0 | frequency_from_cam |
Each returns a float for a number and an array for a sequence or an array,
a zero-dimensional one included. The three
constants are exported as ERB_C1_HZ, ERB_C2_PER_HZ and CAM_C.
Moore-Glasberg loudness (ISO 532-2)
Section titled “Moore-Glasberg loudness (ISO 532-2)”Which recording maps to which arguments
Section titled “Which recording maps to which arguments”field and presentation are not preferences: they are descriptions of how
the sound reached the listener, and getting them wrong costs more than any
difference between the models on this page. ISO 532-2 clause 7.2 lists the
listening situations and the transfer function each needs, and clause 8.1
fixes what the two ears do with the result.
| How the sound was captured | field= |
Why |
|---|---|---|
| One microphone at the centre of the position the absent listener’s head would occupy, one frontal source | 'free' |
Table 1 column 2, the free-field transfer to the tympanic membrane |
| The same microphone in a reverberant room or in situ | 'diffuse' |
Table 1 column 3, the diffuse-field transfer; also the right choice for diffuse-field earphones |
| A probe microphone within 10 mm of the eardrum (5 mm when there are strong components above 3 kHz) | 'eardrum' |
Clause 7.2.4: the spectrum is already at the membrane, so no transfer function is applied |
| A head-and-torso simulator | 'eardrum', but only if the simulator is an accurate acoustical model of an average adult |
Clause 7.2.5; otherwise it needs its own correction file, which this API cannot express. Equalize the recording to the free or diffuse field first and use the matching option |
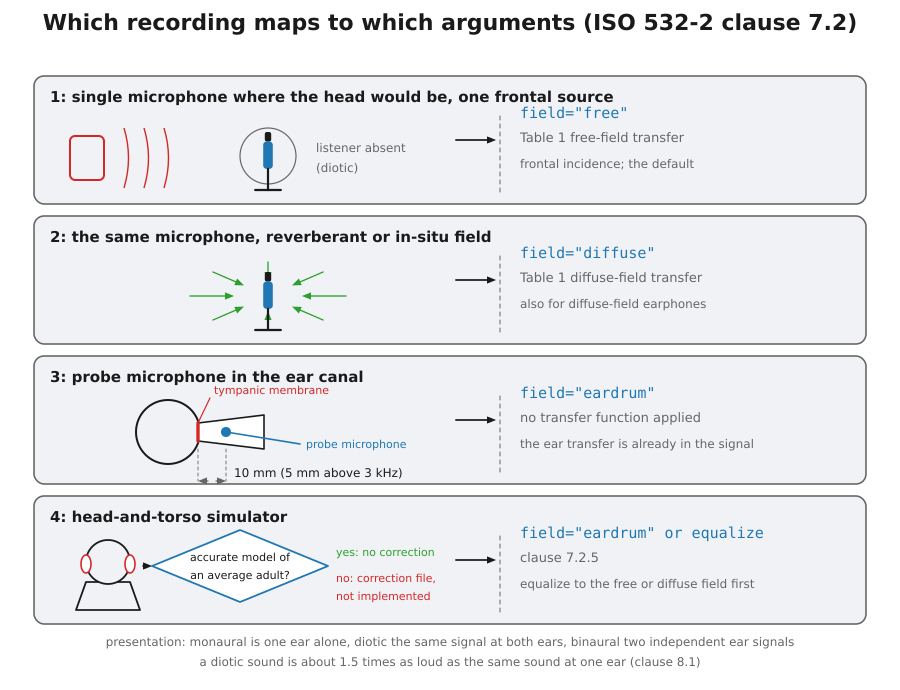
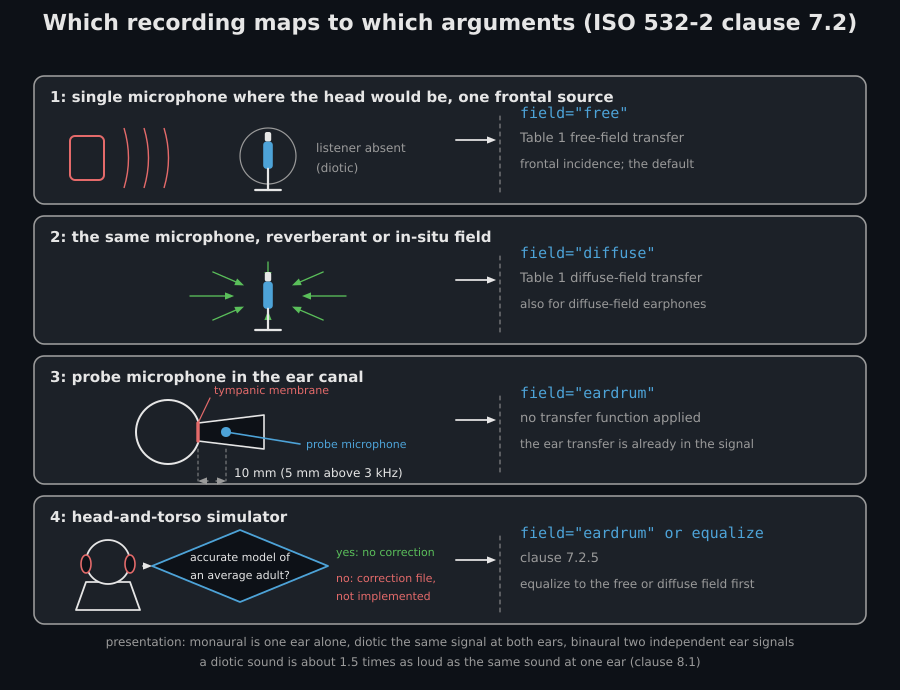
The four situations of clause 7.2, with the geometry that decides them. The distances in scene 3 are the standard’s own: 10 mm from the tympanic membrane, 5 mm when the sound has strong components above 3 kHz.
The failure mode is silent and large. Applying a free-field transfer to a
signal that already contains the ear-canal resonance double-counts a gain of
about 15 dB near 3 kHz: a 3 kHz tone at 70 dB reads 13.8 sone (78.0 phon) with
field="free" and 5.0 sone (62.7 phon) with field="eardrum", and nothing in
the result says which of the two was appropriate. In the other direction, a
free-field recording analysed as 'eardrum' under-reads by the same amount.
presentation is the other factor of two. monaural computes one ear with
the other silent, diotic presents the identical signal to both ears (which
is what a single free-field microphone recording represents, since both ears
hear the same field), and binaural combines two independent ear signals
through the standard’s inhibition stage. The definitional 1 kHz tone at 40 dB
is 1.000 sone diotically and 0.667 sone monaurally, the 1.5 ratio clause 8.1
states, and the inhibition is why two ears give about one and a half times one
ear rather than exactly twice. For a single-spectrum input binaural and
diotic coincide, so the distinction only bites for the two-channel input of
loudness_moore_glasberg_time. Note also that loudness_ecma() offers only
'free' and 'diffuse', so eardrum-referenced material has to be corrected
before it reaches the ECMA-418-2 model.
Where Zwicker uses fixed critical bands on the Bark scale, Moore-Glasberg builds an excitation pattern with level-dependent rounded-exponential (roex) auditory filters on the ERB-number (“Cam”) scale, then applies a compressive excitation → specific-loudness transform with (ISO 532-2:2017, Formula 7) and a binaural-inhibition stage. It reproduces the tone and broadband cases of Annex B to a percent or two and, unlike ISO 532-1, models binaural summation explicitly.
import numpy as npfrom phonometry import psychoacoustics
# The definitional anchor: one 1 kHz sinusoidal component at 40 dB SPL,# free field, binaural -> 1 sone / 40 phon by construction of the sone.res = psychoacoustics.loudness_moore_glasberg_from_spectrum([(1000.0, 40.0)], field="free")print(f"N = {res.loudness:.3f} sone  ({res.loudness_level:.1f} phon)")   # 1.000 sone (40.0 phon)
# From a calibrated recording: the narrowband (FFT) line spectrum is formed# (power-preserving normalization) and fed to the exact sinusoidal-component# method (ISO 532-2 clauses 5.2/5.4).fs = 48000x = np.sqrt(2) * 2e-5 * 10 ** (40 / 20) * np.sin(2 * np.pi * 1000 * np.arange(fs) / fs)res = psychoacoustics.loudness_moore_glasberg(x, fs, field="free", presentation="binaural")
res.plot()   # specific loudness N'(i) over the ERB-number (Cam) scale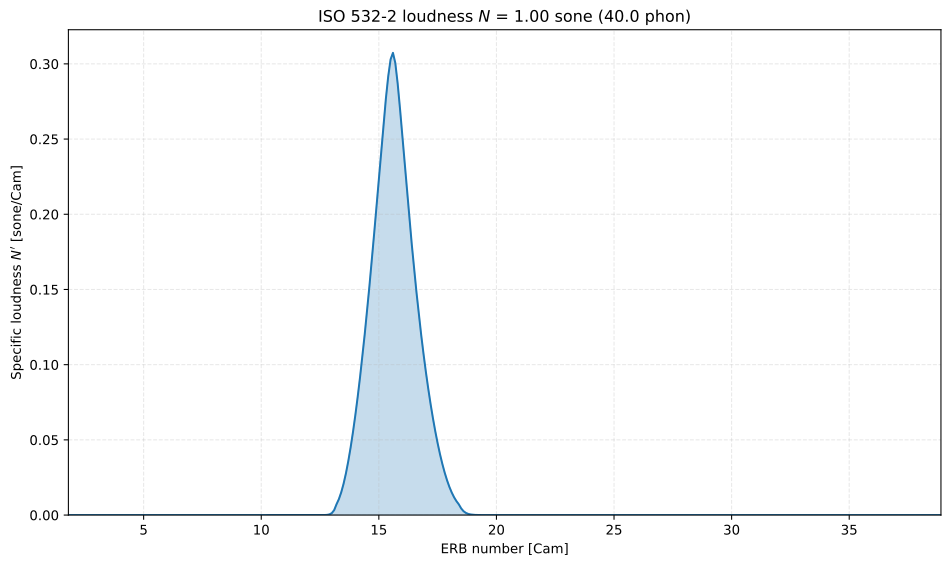
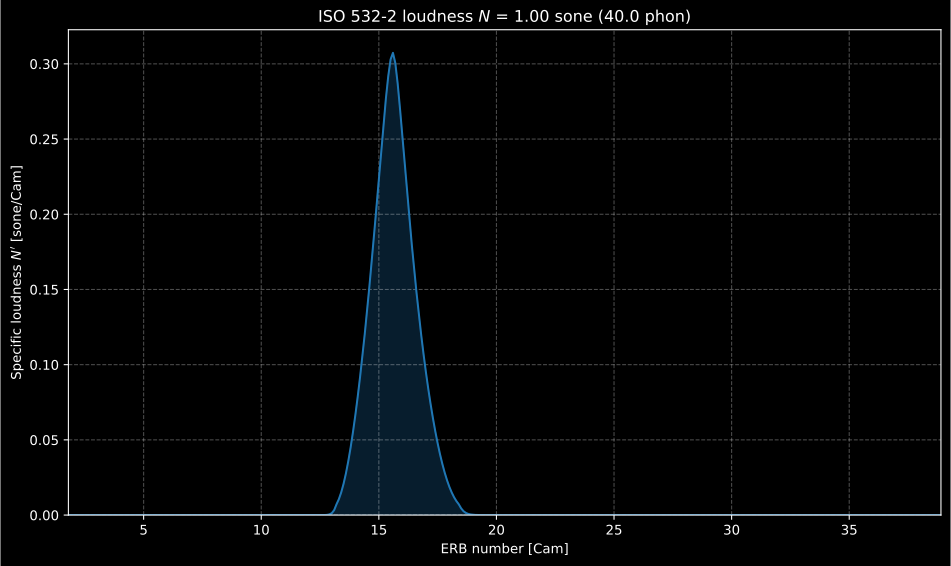
The ISO 532-2 pattern of the definitional 1 sone anchor. The peak is not a spectral line but the excitation the roex filters produce around the tone, so its width is the auditory filter, not the analysis resolution.
Show the code for this figure
import matplotlib.pyplot as pltimport numpy as npfrom phonometry import psychoacoustics
# From a calibrated recording: the narrowband (FFT) line spectrum is formed# (power-preserving normalization) and fed to the exact sinusoidal-component# method (ISO 532-2 clauses 5.2/5.4).fs = 48000x = np.sqrt(2) * 2e-5 * 10 ** (40 / 20) * np.sin(2 * np.pi * 1000 * np.arange(fs) / fs)res = psychoacoustics.loudness_moore_glasberg(x, fs, field="free", presentation="binaural")
# One line — the specific-loudness pattern N'(i) straight from the result:res.plot()plt.show()
# Or draw it by hand from the ERB-number grid the result already carries:fig, ax = plt.subplots()ax.fill_between(res.erb_number, res.specific, alpha=0.3)ax.plot(res.erb_number, res.specific)ax.set_xlabel("ERB number [Cam]")ax.set_ylabel("Specific loudness N' [sone/Cam]")plt.show()
From a one-third-octave spectrum (clause 5.5)
Section titled “From a one-third-octave spectrum (clause 5.5)”The exact method wants sinusoidal components, but clause 5.5 defines the input a meter actually delivers: the levels of the 29 adjacent one-third-octave bands from 25 Hz to 16 kHz on the IEC 61260-1:2014 nominal centres. Each band is assumed flat and expanded internally into an equivalent set of components before the exact method runs. Two constraints are worth stating plainly: exactly 29 values and a fixed grid. A meter that logs 20 Hz to 20 kHz has to be trimmed to it, and one that stops at 8 kHz cannot be used at all.
# `psychoacoustics` is imported by the snippets above.# A ventilation spectrum as a sound level meter logs it: 29 one-third-octave# bands, 25 Hz to 16 kHz, in dB SPL.band_levels = [42.0, 45.0, 48.0, 51.0, 54.0, 56.0, 57.0, 57.0, 56.0, 55.0,               54.0, 53.0, 52.0, 51.0, 50.0, 49.0, 48.0, 47.0, 46.0, 45.0,               43.0, 41.0, 39.0, 37.0, 34.0, 31.0, 28.0, 25.0, 22.0]
n_mg = psychoacoustics.loudness_moore_glasberg_from_third_octave(    band_levels, field="diffuse")print(f"{n_mg.loudness:.1f} sone  ({n_mg.loudness_level:.1f} phon)")  # 17.4 sone (81.3 phon)
# The same measurement through ISO 532-1, which stops one band earlier:n_zw = psychoacoustics.loudness_zwicker_from_spectrum(    band_levels[:28], field="diffuse")print(f"{n_zw.loudness:.1f} sone  ({n_zw.loudness_level:.1f} phon)")  # 13.8 sone (77.9 phon)
The two standards do not even agree on where the spectrum ends: ISO 532-2 takes
29 bands to 16 kHz, ISO 532-1 takes 28 to 12.5 kHz, which is why the slice is
needed. The rest of the gap is the models: roex excitation and explicit
binaural summation against the ISO 532-1 core loudness. Use field="diffuse"
for a room measurement made with a free-field-corrected meter; the field
argument is where band-level users most often go wrong.
loudness_moore_glasberg() and its _from_spectrum / _from_third_octave variants
Section titled “loudness_moore_glasberg() and its _from_spectrum / _from_third_octave variants”The three entry points differ only in how the spectrum is supplied and share
field and presentation.
| Parameter | Applies to | Type | Units | Range / default | Notes |
|---|---|---|---|---|---|
x |
loudness_moore_glasberg |
1D array | Pa | non-empty | Calibrated pressure signal |
fs |
loudness_moore_glasberg |
int | Hz | > 0 | |
components |
_from_spectrum |
list of (f, L) |
Hz, dB SPL | — | Discrete sinusoidal components |
band_levels |
_from_third_octave |
29-vector | dB SPL | 25 Hz .. 16 kHz | IEC 61260-1 nominal centres; exactly 29 |
field |
all three | str | — | 'free' (default) / 'diffuse' / 'eardrum' |
Outer-ear transfer (clause 7.2) |
presentation |
all three | str | — | 'binaural' (default) / 'diotic' / 'monaural' |
Binaural summation (clause 8.1) |
Returns a MooreGlasbergLoudness: loudness (, sone), loudness_level
(phon), specific (, 372 bins of 0.1 Cam), erb_number,
frequencies, field, presentation.
Time-varying loudness (ISO 532-3)
Section titled “Time-varying loudness (ISO 532-3)”ISO 532-3 wraps the same excitation / specific-loudness model in a running multi-resolution spectral analysis (six parallel FFTs, updated every 1 ms) and two cascaded temporal integrators: the fast short-term loudness and the slower long-term loudness . The peak long-term loudness predicts the loudness of sounds up to about 5 s.
import numpy as npfrom phonometry import psychoacoustics
fs = 32000t = np.arange(int(1.3 * fs)) / fsx = np.sqrt(2) * 2e-5 * 10 ** (40 / 20) * np.sin(2 * np.pi * 1000 * t)
res = psychoacoustics.loudness_moore_glasberg_time(x, fs, field="free")print(f"N_max = {res.n_max:.3f} sone  ({res.loudness_level_max:.0f} phon)")   # 1.000 sone (40 phon)print(f"long-term loudness exceeded 5% of the time: {res.percentiles[5.0]:.3f} sone")   # 0.999 sone
res.plot()   # short-term S'(t) and long-term S''(t) loudness vs time
The short-term loudness rises within a few tens of milliseconds and falls back slowly, mimicking the ear’s fast onset sensitivity and its slower recovery; the long-term loudness integrates that trace again with a much longer time constant, so it barely reacts to a single syllable and instead tracks the overall level of an event. The peak of that slow trace, , is the standard’s predictor of the loudness of a short sound, and its validity stops at roughly 5 s because beyond that a listener stops judging the sound as one event. That is also why the percentiles sit beside it: for a sound that fluctuates without a clear event structure, a percentile of the long-term loudness (typically the 5 % value) is the stable statistic, where would be set by the single worst moment.
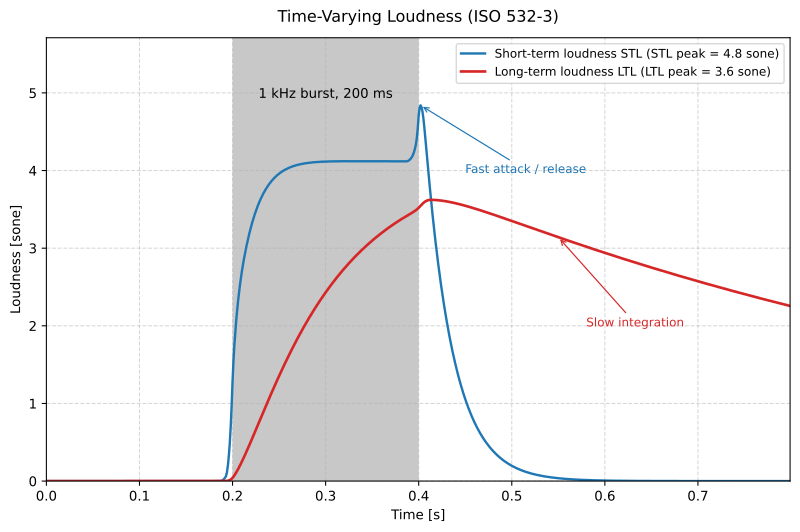
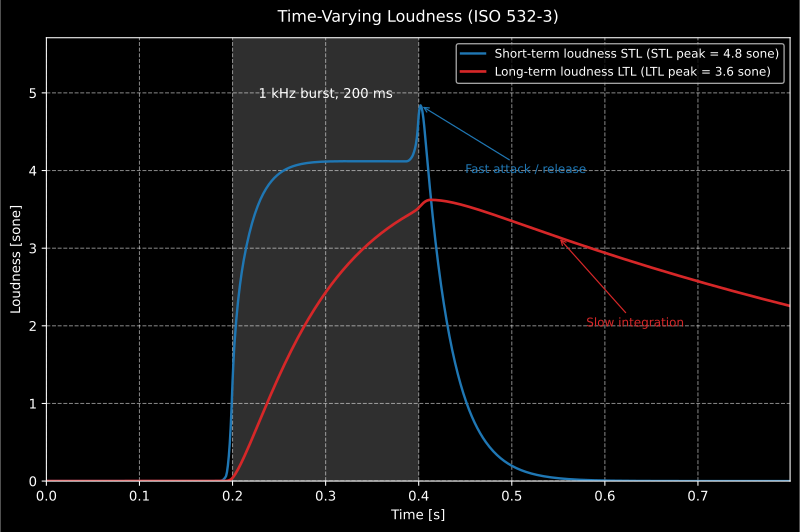
A 200 ms 1 kHz burst at 60 dB SPL: the short-term loudness reaches 4.8 sone within a few tens of milliseconds and releases quickly, while the long-term loudness integrates to 3.6 sone and decays slowly after the burst ends, the pair of time constants ISO 532-3 clauses 7.8/7.9 define.
Show the code for this figure
import matplotlib.pyplot as pltimport numpy as npfrom phonometry import psychoacoustics
# The figure is a burst, not a steady tone: 1 kHz at 60 dB SPL, gated on# between 200 and 400 ms of an 0.8 s record.fs = 48000t = np.arange(int(0.8 * fs)) / fssig = np.zeros_like(t)on = (t >= 0.2) & (t < 0.4)sig[on] = np.sqrt(2) * 2e-5 * 10 ** (60 / 20) * np.sin(2 * np.pi * 1000 * t[on])burst = psychoacoustics.loudness_moore_glasberg_time(sig, fs)print(round(float(burst.short_term_loudness.max()), 1),      round(float(burst.long_term_loudness.max()), 1))   # 4.8  3.6
# The result carries both traces on a 1 ms time axis:burst.plot()plt.show()
# Or draw the fast short-term and the slow long-term trace by hand:fig, ax = plt.subplots()ax.plot(burst.times, burst.short_term_loudness, label="Short-term S'(t)")ax.plot(burst.times, burst.long_term_loudness, label="Long-term S''(t)")ax.set_xlabel("Time [s]")ax.set_ylabel("Loudness [sone]")ax.legend()plt.show()
loudness_moore_glasberg_time() parameters
Section titled “loudness_moore_glasberg_time() parameters”| Parameter | Type | Units | Range / default | Notes |
|---|---|---|---|---|
x |
1D or (n, 2) array |
Pa | non-empty | Mono = diotic; two columns = left/right ears |
fs |
int | Hz | > 0 | |
field |
str | — | 'free' (default) / 'diffuse' / 'eardrum' |
Outer-ear transfer |
presentation |
str | — | 'binaural' (default) / 'diotic' / 'monaural' |
Binaural summation |
percentiles |
sequence | percent | default (1, 5, 10, 50, 90, 95) |
Exceeded long-term loudness levels |
Returns a MooreGlasbergTimeVaryingLoudness: times (1 ms grid),
short_term_loudness / long_term_loudness (sone), their _level in phon,
n_max, loudness_level_max, a percentiles dict, field, presentation.
Sottek Hearing Model loudness (ECMA-418-2)
Section titled “Sottek Hearing Model loudness (ECMA-418-2)”ECMA-418-2:2025 specifies a single auditory front-end (outer/middle-ear
filtering, a 53-band gammatone-like filter bank on the Bark_HMS scale
with , half-wave rectification, block RMS and a compressive
nonlinearity, Formula 23) that is shared by its loudness, tonality and
roughness metrics. The loudness is reported in sone_HMS, and the same
1 kHz/40 dB anchor calibrates the front-end. The clean-room implementation
returns 0.9845 sone_HMS for that anchor rather than exactly 1: the 1.55 %
residual comes from the mandated Clause 6.2.3 band averaging across the
block-size-boundary bands excited by the tone’s lower flank, near 800 to
900 Hz. Without any band averaging the chain reads 0.955, with averaging
restricted to same-block-size neighbours 0.996, and with the full
cross-group recomputation the standard requires 0.9845. The calibration
constant is kept at its verbatim tabulated value rather than retuned,
which is why the deviation is visible at all; the
psychoacoustics.loudness.ecma API reference
carries the full account.
import numpy as npfrom phonometry import psychoacoustics
fs = 48000t = np.arange(int(1.2 * fs)) / fsx = np.sqrt(2) * 2e-5 * 10 ** (40 / 20) * np.sin(2 * np.pi * 1000 * t)
res = psychoacoustics.loudness_ecma(x, fs, field="free")print(f"N = {res.loudness:.4f} sone_HMS")   # 0.9845 sone_HMSprint(res.specific_loudness.shape)          # (53,) average specific loudness N'(z)
res.plot()   # average specific loudness N'(z) + time-dependent N(l) at 187.5 Hz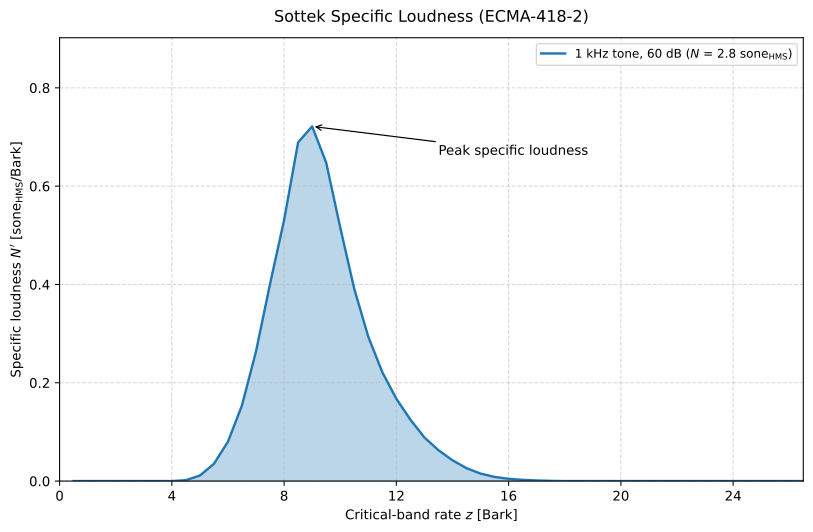
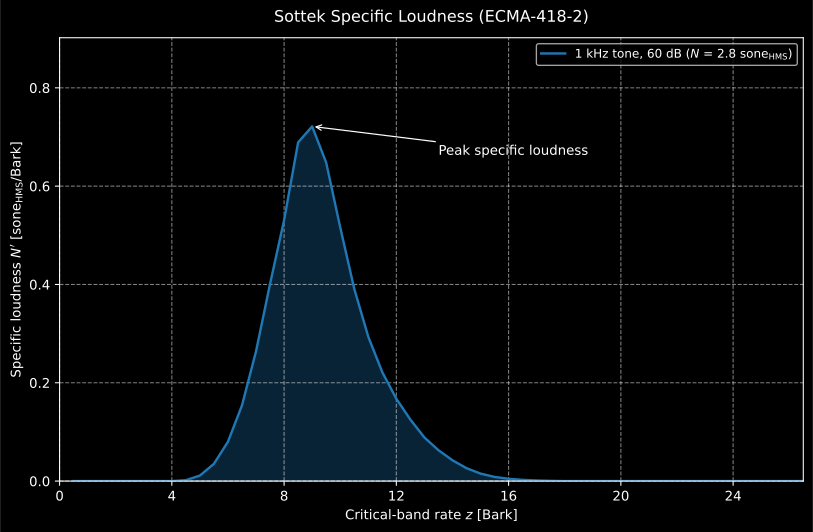
The 1 kHz tone at 60 dB SPL, N = 2.8 sone_HMS, a louder tone than the 40 dB anchor of the snippet above, which gives 0.98 sone_HMS. The loudness is the area under , so a broadband sound spreading a low pattern over many bands can outweigh this single peak.
Show the code for this figure
import matplotlib.pyplot as pltimport numpy as npfrom phonometry import psychoacoustics
# The figure is the 60 dB tone, not the 40 dB anchor of the snippet above.fs = 48000t = np.arange(int(1.2 * fs)) / fsx = np.sqrt(2) * 2e-5 * 10 ** (60 / 20) * np.sin(2 * np.pi * 1000 * t)res = psychoacoustics.loudness_ecma(x, fs, field="free")print(f"N = {res.loudness:.1f} sone_HMS")   # 2.8 sone_HMS
# The result carries the average specific loudness over the 53 Bark_HMS bands:res.plot()plt.show()
# Or draw N'(z) by hand against the critical-band-rate scale:fig, ax = plt.subplots()ax.fill_between(res.bark, res.specific_loudness, alpha=0.3)ax.plot(res.bark, res.specific_loudness)ax.set_xlabel(r"Critical-band rate $z$ [$\mathrm{Bark}_\mathrm{HMS}$]")ax.set_ylabel(r"Specific loudness $N'$ [$\mathrm{sone}_\mathrm{HMS}/\mathrm{Bark}_\mathrm{HMS}$]")plt.show()
loudness_ecma() parameters
Section titled “loudness_ecma() parameters”| Parameter | Type | Units | Range / default | Notes |
|---|---|---|---|---|
x |
1D array | Pa | non-empty | Calibrated pressure signal |
fs |
float | Hz | > 0 | Resampled to 48 kHz internally if needed (Clause 5.1.1) |
field |
str | — | 'free' (default) / 'diffuse' |
Outer/middle-ear filter (Clause 5.1.3) |
Returns an EcmaLoudness: loudness (, sone_HMS), specific_loudness
(, 53 bands), bark, frequencies, times, loudness_vs_time
( at 187.5 Hz), basis_loudness_vs_time (,
sone_HMS, at the same times), last_evaluated_block ( of
Formula 40), field.
Is the sound audible? Clause 5.1.9 calls a signal audible when its total
basis loudness exceeds 0.01 sone_HMS, the
psychoacoustics.AUDIBILITY_THRESHOLD_SONE_HMS the package publishes. That
total, of Formula (26), is the specific basis loudness
of Formula (25), the output of the front-end before any
tonal or noise split, summed over the 53 bands with .
loudness_ecma() returns it block by block as basis_loudness_vs_time, on
the 187.5 Hz grid of times: each band is computed at the block size Clause
5.1.5.1 gives it for loudness (Table 4) and resampled to that grid, as Clause
6.2.6 resamples the tonal and noise loudness. Clause 5.1.9 prints Formula (26)
without a time index and names no segmentation, so one value per block of
this segmentation is this library’s reading; roughness and fluctuation
strength segment by Clause 5.1.5.2 instead, and for a sound that changes in
time they form a different total. No function applies the criterion. The
library compares it with every block up to last_evaluated_block, the
of Formula (40), and calls the sound audible when one of them
exceeds it, a reading of its own too, since Clause 5.1.9 says neither: the
blocks after hold the zero padding whose results Clause 6.2.6
removes, where a sound cut off abruptly leaves the auditory filters ringing.
Compare that total, not loudness, which is the of Formula (117),
assembled from the tonal and noise loudness of Clause 8. A tone at the edge of
hearing can leave below the criterion while its basis loudness clears it:
# `np`, `fs`, `t` and `psychoacoustics` come from the snippet above.# A 1 kHz tone at 0 dB SPL, at the edge of hearing.quiet = np.sqrt(2) * 2e-5 * 10 ** (0 / 20) * np.sin(2 * np.pi * 1000 * t)faint = psychoacoustics.loudness_ecma(quiet, fs, field="free")
# N_basis(l) of the blocks that hold the signal, l = 0 to l_end (Formula 40).n_basis = faint.basis_loudness_vs_time[: faint.last_evaluated_block + 1]audible = n_basis > psychoacoustics.AUDIBILITY_THRESHOLD_SONE_HMSprint(f"N = {faint.loudness:.4f} sone_HMS")           # 0.0034 sone_HMS: N of Formula 117print(f"max N_basis = {n_basis.max():.4f} sone_HMS")  # 0.0118 sone_HMSprint(audible.any())   # True: above the criterion in a block, the library's reading
What this guide covers
Section titled “What this guide covers”Covered
The Glasberg and Moore (1990) ERBN bandwidth and Cam scale of Moore 6e pp. 76-77, via
erb_bandwidth(),cam_from_frequency()andfrequency_from_cam(). ISO 532-2:2017 (Moore-Glasberg): the roex excitation pattern of clause 7 and the binaural inhibition of clause 8, vialoudness_moore_glasberg()and its_from_spectrum/_from_third_octavevariants. ISO 532-3:2023 (Moore-Glasberg-Schlittenlacher): the short-term loudness of clause 7.8, the long-term loudness of clause 7.9 and its peak , vialoudness_moore_glasberg_time(). ECMA-418-2:2025 (Sottek Hearing Model): the loudness assembly of Clause 8, and the total basis loudness of Formula 26 that the audibility criterion of Clause 5.1.9 reads, vialoudness_ecma().Not covered
ECMA-418-2’s binaural combination (Formula 118, Clause 8.1.5) is not implemented:
loudness_ecma()is monaural, so analyse each ear channel separately. The audibility criterion of Clause 5.1.9 is published as a constant and applied by no function: compare the total basis loudness with it, block by block up tolast_evaluated_block. ISO 532-3 Clause 5 prescribes resampling the input to 32 kHz before the running FFT analysis. This implementation processes at the native sampling rate instead, a documented deviation that stays inside the standard’s expanded uncertainty. Resample to 32 kHz first if strict clause-by-clause conformance matters.
Quick answers
Section titled “Quick answers”Which loudness model should I choose: Zwicker, Moore-Glasberg or Sottek?
Section titled “Which loudness model should I choose: Zwicker, Moore-Glasberg or Sottek?”The Zwicker method (ISO 532-1:2017) is the reference: stationary and time-varying, one-third-octave input, fast and widely cited. Moore-Glasberg (ISO 532-2:2017) is stationary, builds roex excitation patterns and models binaural summation explicitly; ISO 532-3:2023 adds time-varying short- and long-term loudness with the peak . The Sottek model (ECMA-418-2:2025) reports sone_HMS and shares its auditory front-end with the ECMA tonality and roughness metrics.
References
Section titled “References”- Ecma International. (2025). Psychoacoustic metrics for ITT equipment — Part 2 (methods for describing human perception based on the Sottek Hearing Model) (ECMA-418-2:2025). The Sottek Hearing Model loudness (sone_HMS), in the 4th edition of June 2025.
- International Organization for Standardization. (2017). Acoustics — Methods for calculating loudness — Part 2: Moore-Glasberg method (ISO 532-2:2017). Stationary loudness from roex excitation patterns on the ERB-number scale, with explicit binaural summation.
- International Organization for Standardization. (2023). Acoustics — Methods for calculating loudness — Part 3: Moore-Glasberg-Schlittenlacher method (ISO 532-3:2023). Time-varying short-term and long-term loudness and the peak N_max.
- Moore, B. C. J. (2013). An introduction to the psychology of hearing (6th ed.). Brill. https://doi.org/10.1163/9789004252424 The ERB_N auditory-filter bandwidth and the Cam (ERB_N number) scale of Glasberg and Moore (1990), pp. 76-77.