Environmental Levels (ISO 1996-1/-2)
Standards: ISO 1996
Verified by 4 conformance checks against ISO 1996-1:2016, ISO 1996-2:2007 and ISO 1996-2:2017: 4 in Levels & dosimetry.
A community does not hear a single : it hears a day whose evenings and nights matter more, a source whose tones or impulses annoy beyond their energy, and a measurement taken over a residual background with a finite confidence. The tonal half of that sentence is this page; the impulsive half belongs to Impulsive sound prominence, which measures the adjustment ISO 1996-1 Table A.1 only tabulates. This page is the regulatory assessment chain built on top of the measured period levels: the whole-day descriptors / and the composite rating levels of ISO 1996-1, and the ISO 1996-2 determination procedures that make the reported number defensible: the tonal adjustment, the residual-noise correction and the measurement uncertainty budget.
The level computation itself, the / integrals, the percentile levels , SEL and the noise dose that produce the period levels this page consumes, is Integrated and Statistical Levels; everything here assumes those per-period values are already in hand.
Environmental noise: Lden, Ldn and rating levels (ISO 1996-1)
Section titled “Environmental noise: Lden, Ldn and rating levels (ISO 1996-1)”Regulatory noise assessment weights evenings and nights more heavily.
lden() implements the day-evening-night level of ISO 1996-1:2016 (3.6.4:
+5 dB evening, +10 dB night, default 12/4/8 h periods, adjustable because
countries define them differently), ldn() the day-night variant (3.6.5),
and composite_rating_level() the general whole-day composite of clause 6.5
(Formulae 5-6) for arbitrary periods with source or character adjustments
(Table A.1: e.g. +5 dB regular impulsive, +12 dB highly impulsive, +3 to
+6 dB prominent tones):
from phonometry import environment
l = environment.lden(63.2, 58.1, 51.4)                # from LAeq per periodr = environment.composite_rating_level([    (63.2, 12, 0.0),                                  # day    (58.1, 4, 5.0),                                   # evening (+5)    (51.4, 8, 10.0),                                  # night  (+10)])print(round(l, 2), round(r, 2))                       # 62.66 62.66
The two agree to the last digit, which is the point of the snippet:
lden is composite_rating_level with the three ISO 1996-1 periods and their
time-of-day adjustments filled in.
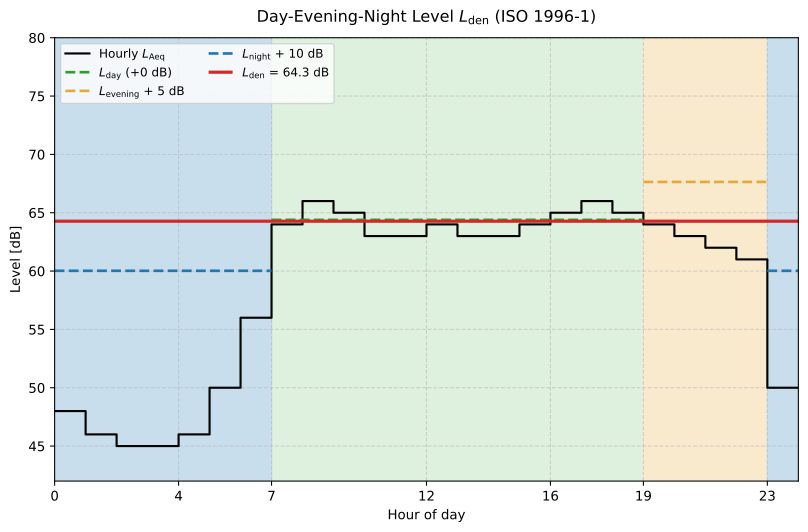
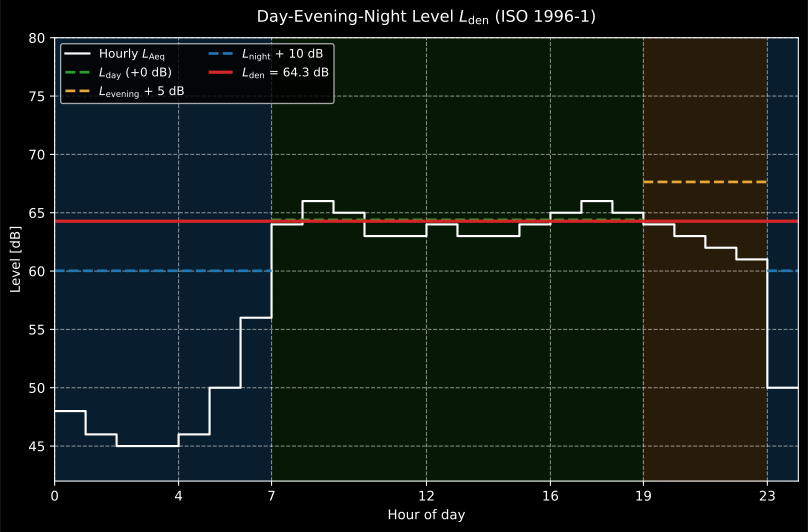
The same day weighted three ways: the evening band is lifted 5 dB and the night band 10 dB before the 12/4/8 h energy average, which is why an of 64.3 dB sits above every hourly level of the night.
What 64.3 dB means. The scale is worth carrying: a rural night sits in the 40s, a quiet residential street in the mid-50s, a façade on a busy urban arterial in the high 60s, and the Environmental Noise Directive reports strategic maps in 5 dB bands from 55 dB upward. The +5 and +10 dB weights are the price of exposure at the hours when people are at home and asleep, so an evening or a night source moves far more than its energy share suggests: in the profile above, the evening is 1.8 dB quieter than the day and lasts a third as long, yet the +5 dB weight gives it 36 % of the energy that makes up the 64.3 dB against the day’s 51 %. Two limits on reading it. The reported indicator is a long-term average: ISO 1996-1 defines its periods over a long-term time interval, normally a year, so the worked day here is one sample of an and not an . And the number is an exposure, not a response; ISO 1996-1 carries annexes that map an adjusted or onto an estimated percentage of a population highly annoyed, which is informative and is not implemented here.
Show the code for this figure
import numpy as npimport matplotlib.pyplot as pltfrom phonometry import environment
# Synthetic hourly LAeq of an urban road (dB), hours 00 to 23laeq_h = np.array([48, 46, 45, 45, 46, 50, 56, 64, 66, 65, 63, 63,                   64, 63, 63, 64, 65, 66, 65, 64, 63, 62, 61, 50], dtype=float)
def period_leq(idx):    return 10 * np.log10(np.mean(10 ** (laeq_h[idx] / 10)))  # energy mean
ld = period_leq(np.arange(7, 19))                # day 07-19le = period_leq(np.arange(19, 23))               # evening 19-23ln_ = period_leq(np.r_[23, np.arange(0, 7)])     # night 23-07l_den = environment.lden(ld, le, ln_)print(f"Lden = {l_den:.1f} dB")   # Lden = 64.3 dB
fig, ax = plt.subplots()ax.axvspan(19, 23, color="C1", alpha=0.15)                                # eveningax.axvspan(23, 24, color="C0", alpha=0.15); ax.axvspan(0, 7, color="C0", alpha=0.15)ax.step(np.arange(25), np.r_[laeq_h, laeq_h[-1]], where="post",        color="0.3", label="Hourly LAeq")ax.hlines(ld, 7, 19, color="C2", linestyle="--", label="Lday (+0 dB)")ax.hlines(le + 5, 19, 23, color="C1", linestyle="--", label="Levening + 5 dB")ax.hlines([ln_ + 10, ln_ + 10], [23, 0], [24, 7], color="C0",          linestyle="--", label="Lnight + 10 dB")ax.hlines(l_den, 0, 24, color="C3", linewidth=2, label=f"Lden = {l_den:.1f} dB")ax.set(xlabel="Hour of day", ylabel="Level [dB]", xlim=(0, 24))ax.legend(loc="upper left", fontsize=8, ncol=2)plt.show()
A year of city noise against its published period levels
Section titled “A year of city noise against its published period levels”The day above is synthetic, and it is a single day. The repository also keeps
a real year: the five-minute that two permanent monitors of
Dublin City Council logged through 2015, one at Ballymun and one at Ringsend.
The council’s annual report for that year tabulates each site’s annual day,
evening and night levels and its in whole decibels (Fig. 3,
p. 11), and its text quotes the night levels, 58 dB(A) at Ballymun and
59 dB(A) at Ringsend (p. 11). The report averages logarithmically (p. 8) and
takes the evening from 19:00 to 23:00 and, as ISO 1996-1 does, the night from
23:00 to 07:00 (p. 9). The library takes period levels, not a series of
stamped intervals, so the snippet files each interval itself by the hour it
starts in (the stamps mark where an interval ends), takes the energy average
of each period and hands the three levels to environment.lden.
The data. Five-minute LAeq series from the Dublin City Council Ambient Sound Monitoring Network (Ballymun and Ringsend, 2015), Smart Dublin / data.gov.ie, licensed CC BY 4.0. Changes: daily logs concatenated, sorted and de-duplicated; level values unmodified.
The file is read from a checkout of the repository, where the oracle test reads it too; a wheel does not install the test data.
import pathlib
import numpy as npimport phonometryfrom phonometry import environment
# The committed series lives in the repository, so this runs from a checkout#   (or an editable install); with your own monitor's export, load that instead.repo = pathlib.Path(phonometry.__file__).resolve().parents[2]# The council's annual report for 2015, Fig. 3 (p. 11): each site's annual Lday,#   Levening, Lnight and Lden, in whole dB(A).published = {"ballymun": (65, 63, 58, 67), "ringsend": (59, 60, 59, 65)}

def energy_mean(levels):    """The energy average of a set of levels: the report's logarithmic mean."""    return 10 * np.log10(np.mean(10 ** (levels / 10)))

with np.load(repo / "tests/data/audio/dublin/dcc_laeq_5min_2015.npz") as npz:    for site, row in published.items():        # Each stamp ends a five-minute interval, in seconds since 2015-01-01 00:00.        stamps = int(npz[f"{site}_time0_s"]) + np.concatenate(([0], np.cumsum(npz[f"{site}_dt_s"])))        laeq = npz[f"{site}_laeq_cdb"] / 100.0        # File each interval by the hour it starts in: day 07-19, evening 19-23, night 23-07.        hour = ((stamps - 300) // 3600) % 24        night = (hour >= 23) | (hour < 7)        evening = (hour >= 19) & (hour < 23)        day = ~night & ~evening        lday, levening, lnight = (energy_mean(laeq[period]) for period in (day, evening, night))        levels = (lday, levening, lnight, environment.lden(lday, levening, lnight))        # Lday, Levening, Lnight and Lden as computed, then as the report prints them.        print(f"{laeq.size} intervals at {site}:", *(f"{level:.2f}" for level in levels),              "dB(A), published", *row)# 104242 intervals at ballymun: 64.57 63.34 57.98 66.69 dB(A), published 65 63 58 67# 104657 intervals at ringsend: 59.35 59.66 58.81 65.38 dB(A), published 59 60 59 65
Both sites land on the report: every level rounds to the whole decibel Fig. 3 prints, the night levels of 57.98 dB(A) at Ballymun and 58.81 dB(A) at Ringsend to the 58 and 59 its text quotes. The report prints whole decibels, so the test that holds this computation allows half a decibel either way on all four levels and asserts the rounding as well: rounded to the nearest decibel every value matches, while truncated both night levels would fall a decibel short. shows the weighting at work: Ringsend is the louder site at night, Ballymun the louder over the weighted whole day.
lden() / ldn() / composite_rating_level() parameters
Section titled “lden() / ldn() / composite_rating_level() parameters”| Function | Key parameters | Notes |
|---|---|---|
lden(lday, levening, lnight, period_hours=(12, 4, 8)) |
period values [dB]; period_hours must sum to 24 |
+5 dB evening, +10 dB night (3.6.4) |
ldn(lday, lnight, period_hours=(15, 9)) |
+10 dB night (3.6.5) | |
composite_rating_level(periods) |
iterable of (level, hours, adjustment); hours positive, finite and summing to 24 |
General Formulae (5)-(6); adjustments per Table A.1 |
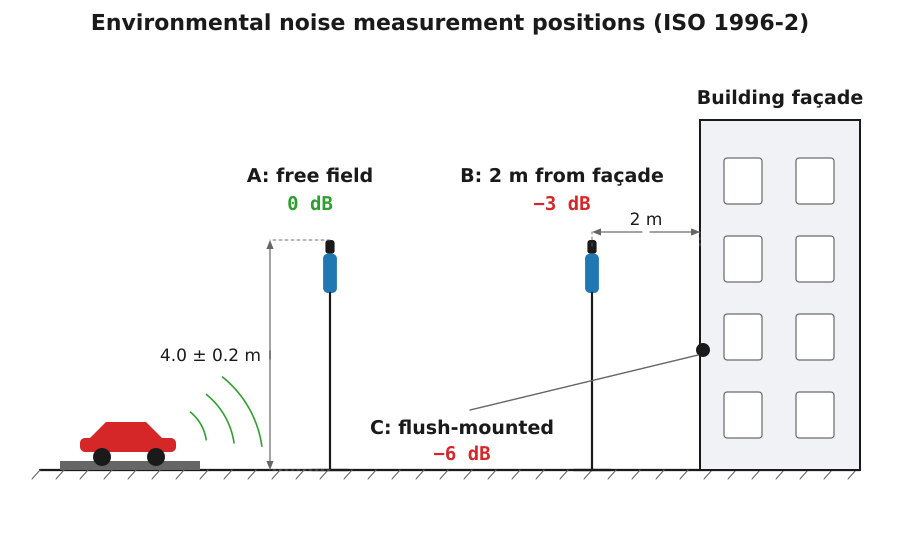
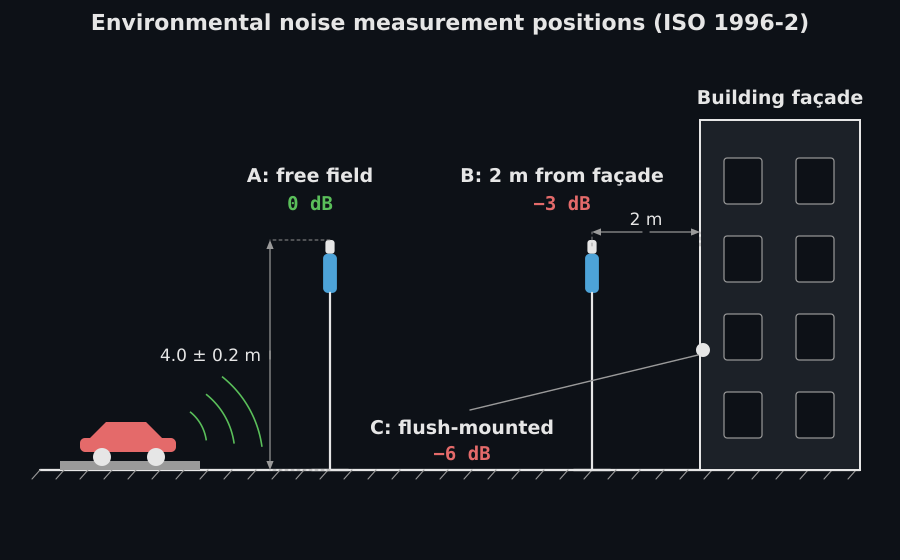
Where you put the microphone changes the number: ISO 1996-2 fixes the receiver positions and their façade corrections. The diagram is measurement context; apply the corrections to your levels before anything on this page:
| Microphone location | Correction to reach the incident (free-field) reference | The condition it holds under |
|---|---|---|
| Incident sound field | 0 dB, this is the reference condition | No reflecting surface other than the ground close enough to matter |
| Flush-mounted on the façade | Subtract up to 6 dB; exactly 5.7 dB where the Annex B conditions are met | Façade plane within ±0.05 m over 1 m around the microphone, and more than 1 m from any edge of the wall |
| 0.5 m to 2 m in front of the façade | Subtract up to 3 dB; exactly 3 dB where the Annex B conditions are met | An otherwise open situation. Not recommended at near-grazing incidence, and a street canyon or a dense block can make the real difference much larger |
(ISO 1996-2:2017, 9.2.1 and Annex B. For general mapping in multi-storey residential areas the same clause fixes the microphone height at (4.0 ± 0.2) m.)
The reason the two corrections are not simply 6 and 3 dB is interference. Flush-mounted, the direct and reflected waves are in phase everywhere on the surface, so the doubling is coherent and broadband, which is why Annex B recommends this position, not the 3 dB one, for stationary sources and low frequencies. Two metres out, the path difference is finite and frequency dependent, so the 3 dB is an ideal-case average that a canyon or a nearby building breaks; Table B.1 puts the standard uncertainty of the correction at 0.4 dB for either position under traffic noise from all angles, but at 2.0 dB for the 5.7 dB position and 1.0 dB for the 3 dB position under predominantly grazing incidence.
Two consequences for everything below. lden, ldn and
composite_rating_level consume the corrected level, so applying the
correction is the reader’s step and no function on this page will do it. And the
reported level must always name its position and state whether a correction was
made: a rule the standard states in the same clause, and the reason an END
façade indicator, which is defined to include the reflection, must not be
corrected at all.
Combine with laeq() per time period to go from recordings to . The
tonal adjustment itself is justified by the tonal audibility route of the next
section (fed, for the ISO/PAS 20065 method, by
Objective audibility of tones in noise);
the tone_to_noise_ratio() / prominence_ratio() verdicts of
Prominent Discrete Tones are
complementary emission screening, not the basis.
Determining levels: tonal adjustment, residual noise and uncertainty (ISO 1996-2)
Section titled “Determining levels: tonal adjustment, residual noise and uncertainty (ISO 1996-2)”ISO 1996-2:2017 is the determination part: how the measured level is turned into a rating level and reported with its uncertainty. The rating-level summation and the time-of-day penalties live in ISO 1996-1 (above); ISO 1996-2 supplies the tonal adjustment, the residual-noise correction and the uncertainty budget.
The measurement behind the numbers (Clause 5)
Section titled “The measurement behind the numbers (Clause 5)”Everything on this page assumes a level that was obtained the way ISO 1996-2 requires, and the requirements are short enough to state in full.
The whole chain (microphones, cables, windscreens, recording devices and any other accessory) meets class 1 of IEC 61672-1, for free-field or random-incidence application as appropriate, and the filters meet class 1 of IEC 61260 (5.1). A windscreen is always used outdoors, and it does not make wind noise go away: the standard’s own estimate for a 13 mm microphone in a 90 mm windscreen is an A-weighted wind-noise level of about dB with the wind normal to the diaphragm and dB with it parallel, in m/s, which is 31 dB(A) at 5 m/s and 52 dB(A) at 10 m/s, i.e. above the residual of a quiet rural night before the wind is anywhere near a gale. Class 1 tolerance limits themselves only apply between −10 °C and +50 °C.
Calibration (5.2) is a check at the start and the end of every measurement with a class 1 IEC 60942 sound calibrator. The acceptance criterion is explicit: without any readjustment the two consecutive checks must differ by ≤ 0.5 dB, and if they do not, everything measured since the previous satisfactory check is discarded. That is the single rule that most often costs a campaign a day, and it is why the closing check is not optional. For monitoring over several days or more, ISO 20906 takes over.
Verification (5.3) is a valid certificate of compliance against IEC 61672-3, IEC 61260 and IEC 60942, issued by a laboratory meeting ISO/IEC 17025 with traceability to national standards; the recommended interval is once a year and the maximum allowable interval is two years.
The meteorological sensors carry their own maximum permissible errors (5.4), and they are what the uncertainty budget below silently assumes: ±0.5 K for temperature, ±5.0 % for relative humidity, ±0.5 hPa for barometric pressure, ±0.5 m/s for wind speed and ±5° for wind direction.
Finally, a measured environmental level is only reportable with its context. Clause 13 lists what has to be recorded: the time, day and place; the instrumentation and how it was calibrated; the measured and corrected levels; the percentile levels with the base they were computed on; the estimated expanded uncertainty with its coverage probability; the residual sound levels during the measurement; the time intervals; a description of the site including ground cover and the heights of microphone and source above it; and the source operating conditions, including how many events of each category were captured.
The weather and the time to measure (Clauses 6, 8 and 9)
Section titled “The weather and the time to measure (Clauses 6, 8 and 9)”The instrument is the smaller half of the requirement. The other half is the weather the level is taken in, for how long and how many times, and ISO 1996-2 states each of them.
What is recorded about the weather (8.1, 9.3.5). For long-term and short-term measurements alike the meteorological parameters are measured: as a minimum wind speed, wind direction, relative humidity and temperature, with information about atmospheric stability, measured directly or taken from cloud cover and time of day, and about precipitation if there is any. Wind speed and wind direction are measured at a height of 10 m. A lower mast is admitted for practical reasons, but it raises the uncertainty, because the data and the experience behind the standard were gathered at 10 m.
When the weather matters (8.1). Over soft ground the level varies only modestly with the weather as long as (Formula (11)): source height plus receiver height against the horizontal distance between them. A microphone at 4 m and a source at 0.5 m satisfy it out to 45 m; over hard ground larger distances may be acceptable. Beyond that distance the propagation is classed by how far the sound paths bend in the direction of the shortest distance from the receiver to the source, through the ratio of the distance to the radius of curvature of the paths, which is negative when they curve upwards. Table 4 gives four meteorological windows:
| Window | Representative value | Propagation | Typical wind component at 10 m | |
|---|---|---|---|---|
| M1 | below −0.04 | −0.08 | unfavourable | below 1 m/s by day, below −1 m/s by night |
| M2 | −0.04 to 0.04 | 0.00 | neutral | 1 m/s to 3 m/s |
| M3 | 0.04 to 0.12 | 0.08 | favourable | 3 m/s to 6 m/s |
| M4 | above 0.12 | 0.16 | very favourable | above 6 m/s by day, −1 m/s or more by night |
The wind component is the one along the line from the source to the receiver, and a minus sign means that the wind blows from the receiver towards the source. The standard calls the table simplified and admits any other description that achieves the same curvatures; can also be calculated from the measured meteorological parameters with the informative Annex A, and the description may not suit very high sources such as wind turbines. Table 4 gives no angular sector for the wind: the windows are defined by , and the wind components are the typical values that go with them.
One measurement or a few (6.1, 8.2). For a single measurement to mean anything, the minimum is that it is taken under favourable propagation and that the source operation is monitored while it lasts (6.1). Clause 8.2 puts it as a recommendation for one or a few short-term measurements: take them in window M3 or M4, or where Formula (11) holds. Then, unless better information is available, the standard uncertainty of the meteorology is 2 dB for m (Formula (12)), which is the 2.00 dB row of the budget further down, and dB beyond that distance (Formula (13)): 3 dB at 800 m. The clause warns that it may not suit aircraft noise entirely, because the direction of take-off and landing follows the wind along the runway, and that some microphone locations never have favourable propagation.
Rain (8.3). Results taken with precipitation on the windscreen are discarded unless its effect can be shown to have been negligible. A windscreen that has been rained on stays altered after the rain stops: for a standard 9 cm windscreen the effect can be significant above 1 kHz once more than 1 mm has fallen, and it lasts until the windscreen has dried, a time that Formula (14) estimates from the amount of rain, as an example only. Data taken meanwhile remain usable if the added uncertainty is taken into account.
How long (9.1.2, 9.3.2.2). The measurement time interval covers all the significant variations of the emission. If the noise is periodic the interval preferably spans a whole number of several periods, or else several intervals each represent a part of the cycle and together the whole of it. For single events, such as an aircraft fly-over, the intervals are chosen so that the sound exposure level of the event can be determined. Against the weather there is a number: is measured in frequency bands for at least 30 min, to average the meteorological variations along the path, unless Formula (11) holds or the propagation is favourable, when 10 min is usually sufficient (9.3.2.2), and 10 min is also the minimum averaging time of a short-term measurement that needs favourable conditions over a distance Formula (11) does not cover (9.1.2). Both minima are increased as far as a representative sample of the source operation requires (Clause 7).
How many (6.1, 6.2, 9.1.1). The standard fixes no number of intervals and no upper limit of uncertainty: it leaves the accuracy to aim for to whoever uses the result, and requires the uncertainty to be determined. It offers two strategies: a single measurement under very well-defined meteorological conditions with the source operation carefully monitored, or a long-term measurement, or many sampled ones, spread over time with the meteorology monitored. In the second, each result is filed in a window, a combination of an emission condition (day, evening or night, for instance) and one of the four meteorological windows. The level of a window is the energy mean of the independent measurements made in it (Formula (6)), and the long-term level weights the windows by how often each occurs (Formula (5)), so a long-term campaign includes as many of the important emission and propagation conditions as it can, and above all the windows that contribute most (9.1.1). Two measurements count as independent only when enough time separates them. Table 3 gives the guidance: for road traffic 24 h under 100 m, 48 h from 100 m to 300 m and 72 h beyond, by day and by night. The table has rows for rail, industry and aircraft too, and in several of their cells it is the operation of the source that sets the minimum.
Tonal adjustment (engineering method, ISO 1996-2:2007 Annex C)
Section titled “Tonal adjustment (engineering method, ISO 1996-2:2007 Annex C)”The 2017
edition dropped the self-contained algorithm and refers to ISO/PAS 20065
instead (Objective audibility of tones in noise);
what it keeps is the Annex J table that converts a mean audibility into an
integer adjustment. The 2007 algorithm is the one implemented here, because it
runs on a single spectrum. From the energy-summed tone
level and the masking-noise level in the critical band around a
tone, the audibility above the masking threshold is
dB (Formula (C.3)),
and the adjustment is for ,
for and above (Formulae (C.4)–(C.6)). The
critical bandwidth is 100 Hz up to 500 Hz and 20 % of above (Table C.1).
The one-third-octave survey method (assess_tonal_survey) flags a band
exceeding both neighbours by 15/8/5 dB (low/mid/high), and
tonal_adjustment_from_mean_audibility maps the ISO/PAS 20065 mean audibility to
(Table J.1).
The chain is three functions, not one: tonal_audibility(Lpt, Lpn, fc) returns
from Formula (C.3), tonal_adjustment(dLta) maps it to
through Formulae (C.4)-(C.6), and assess_tonal_audibility(...) combines both
with critical_bandwidth into the plottable result the snippets below use.
The two lower-level functions are the ones the
Spanish regulation guide
and the wind-turbine guide
refer to by name, so they are worth calling directly when only one step is
wanted.
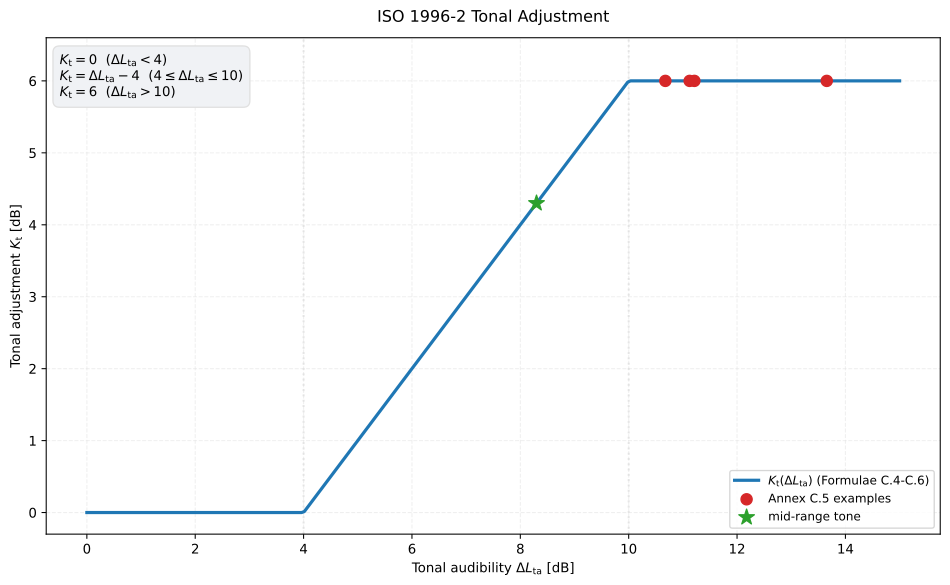
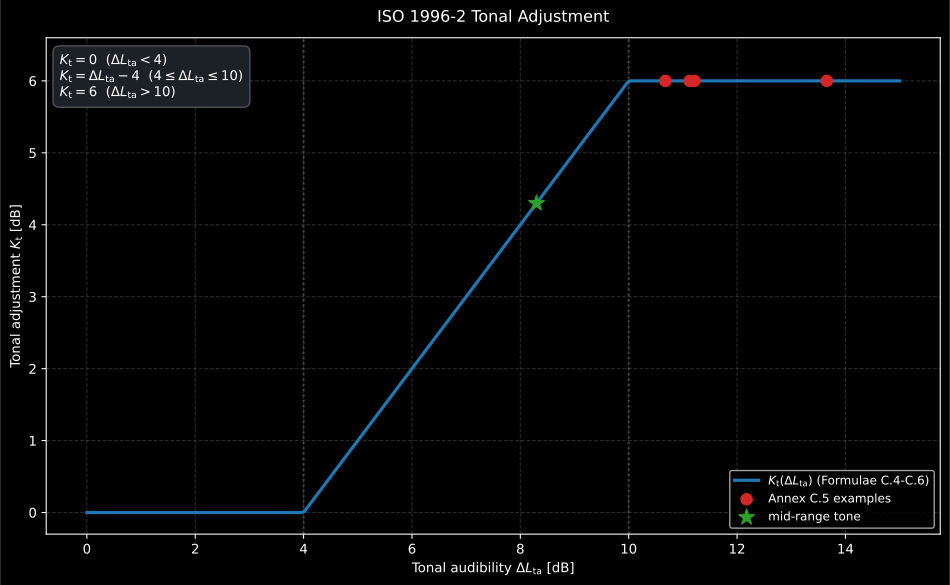
The adjustment saturates at both ends: below 4 dB of audibility a tone costs nothing and above 10 dB it costs no more than 6 dB, so the whole decision lives in a 6 dB window of . All four Annex C.5 examples land in or above that window.
Show the code for this figure
import matplotlib.pyplot as pltfrom phonometry import environment
# The worked example is ISO 1996-2:2007 Annex C.5, Example 2 (two tones near# 400 Hz): the 2017 edition dropped the algorithm and with it its examples,# so the numbers below come from the edition that carries the method.# ISO 1996-2:2007 Annex C.5, Example 2 (two tones near 400 Hz):res = environment.assess_tonal_audibility(tone_level=54.1, masking_noise_level=45.2,                              center_frequency=430.0)print(res.audibility, res.adjustment)   # ΔLta ≈ 11.1 dB -> Kt = 6 dBres.plot()plt.show()
Residual-noise correction (Clause 10.4)
Section titled “Residual-noise correction (Clause 10.4)”residual_sound_correction()
applies (Formula (16)). With a
residual within 3 dB of the measured level no correction is allowed: the
uncorrected measured level is then the reportable value, as an upper
bound of the specific sound (exposed as reportable_upper_bound, with
reliable=False). gaussian_residual_level() estimates the residual from
percentile levels (Annex I) and rejects inverted percentile orderings.
Measurement uncertainty (Clause 4, Annex F)
Section titled “Measurement uncertainty (Clause 4, Annex F)”metrology.combined_standard_uncertainty(), the one root-sum-square the
library has, forms (Formula (2)) and
environmental_expanded_uncertainty() applies (95 %) or (80 %);
residual_correction_uncertainty() carries the residual-correction sensitivity
(Formulae (F.7)/(F.8)) and uncertainty_from_repeated_measurements() the
repeated-measurement standard uncertainty: the primary energy-domain route
(Formulae (17)+(19)), with the level-domain Note 2 substitute (Formula (20))
reported alongside as approximate_uncertainty and a warning when the levels
spread beyond 3 dB, where the substitute grossly inflates.
from phonometry import environment, metrology
tonal = environment.assess_tonal_audibility(54.1, 45.2, 430.0)  # TonalAssessmentResultkt = tonal.adjustment                                             # 6 dBtonal.plot()   # this audibility on the Kt curve, as in the figure abovecorr = environment.residual_sound_correction(measured_level=58.0, residual_level=50.0)print(round(corr.corrected_level, 2), corr.reliable)          # 57.25 True
# Table G.2: one hour beside a road under favourable conditions. The five# contributions are the measured level (0.5 dB scaled by the F.7 sensitivity),# the source operating conditions (1000 vehicles counted, 10/sqrt(1000)),# the meteorology, the microphone-location correction and the residual.u = metrology.combined_standard_uncertainty([0.59, 0.3, 2.0, 0.40, 0.38])print(round(u, 2))                                             # 2.18 dB (G.2)print(round(environment.environmental_expanded_uncertainty(u), 2))           # 4.36 dB (k = 2)
The list is not five anonymous numbers. It is the Table G.2 budget of ISO 1996-2:2017 and every entry has a name, a source and a size:
| Contribution | Where it comes from | |
|---|---|---|
| Measured level | dB (which already absorbs the class 1 sound level meter’s own 0.5 dB default), multiplied by the residual-correction sensitivity of Formula (F.7) | 0.59 dB |
| Source operating conditions | 1 000 vehicles counted, (Formula (8)) | 0.30 dB |
| Meteorology | favourable conditions, Formula (12) | 2.00 dB |
| Microphone location | the +5.7 dB flush-mounted correction of Annex B | 0.40 dB |
| Residual sound | dB with dB, through the sensitivity of Formula (F.8) | 0.38 dB |
metrology.combined_standard_uncertainty also accepts pairs, so the
sensitivity coefficients need not be pre-multiplied by hand, and
residual_correction_uncertainty supplies exactly the two coefficients of
Formulae (F.7)/(F.8), both of which grow without bound as the residual
approaches the measured level, which is the same 3 dB cliff as above seen from
the uncertainty side.
Now read the column. The meteorology term alone is 2.0 dB and it sets the
answer: drop it and the combined uncertainty falls from 2.18 dB to 0.86 dB. The
instrument is nowhere near the top of the list. A class 1 meter does not make
an environmental measurement accurate. How representative the propagation
conditions and the source operation were during that hour is what decides it, and
the cheapest way to shrink is therefore to measure more often, which is what
uncertainty_from_repeated_measurements is for. What the standard asks of the
weather, and for how long, is in
the weather and the time to measure
above.
What this guide covers
Section titled “What this guide covers”Covered
ISO 1996-1:2016’s , and composite rating level (clause 6.5,
environment.lden/ldn/composite_rating_level); and ISO 1996-2:2007’s Annex C tonal adjustment together with ISO 1996-2:2017’s residual-noise correction (Clause 10.4), measurement uncertainty budget (Clause 4, Annex F), Annex J mean-audibility mapping and Annex K survey method.Not covered
ISO 1996-2 fixes the receiver positions and the façade corrections that turn a raw measurement into the level this page’s functions expect: those position and correction procedures are not implemented, only the arithmetic that follows once you have applied them. The meteorological windows of Clause 8 and the measurement time intervals of Clause 9 are stated on this page and not computed either: no function classifies the weather or derives the radius of curvature of Annex A.
Quick answers
Section titled “Quick answers”What penalties does Lden apply to evening and night noise?
Section titled “What penalties does Lden apply to evening and night noise?”, the day-evening-night level of ISO 1996-1:2016 (3.6.4), adds +5 dB to the evening level and +10 dB to the night level before energy-averaging the whole day, with default periods of 12, 4 and 8 hours, adjustable because countries define them differently. The day-night variant (3.6.5) keeps only the +10 dB night penalty.
References
Section titled “References”- British Standards Institution. (2003). Description and measurement of environmental noise — Guide to quantities and procedures (BS 7445-1:2003). The survey-practice companion of ISO 1996-1: which descriptor family fits which assessment question, and the measurement procedures around them (BS 7445-2:1991 covers the land-use data acquisition).
- Dublin City Council. (2016). Ambient Sound Monitoring Network annual report for 2015. The published annual levels the worked case reproduces: each site's Lday, Levening, Lnight and Lden in whole decibels (Fig. 3, p. 11), the night levels quoted as 58 dB(A) at Ballymun and 59 dB(A) at Ringsend (p. 11), averaged logarithmically (p. 8), with the evening from 19:00 to 23:00 and the night from 23:00 to 07:00 (p. 9).
- Dublin City Council. (2017). Ambient Sound Monitoring Network DCC [Data set]. Smart Dublin. The year of five-minute LAeq of the worked case: the Ballymun and Ringsend monitors through 2015, whose series the repository keeps.
- International Organization for Standardization. (2007). Acoustics — Description, measurement and assessment of environmental noise — Part 2: Determination of sound pressure levels (ISO 1996-2:2007). Annex C: the critical bandwidth of Table C.1, the audibility of Formula (C.3) and the piecewise adjustment of Formulae (C.4)-(C.6). This is the self-contained engineering method the library implements; the 2009 corrected reprint is identical here.
- International Organization for Standardization. (2016). Acoustics — Description, measurement and assessment of environmental noise — Part 1: Basic quantities and assessment procedures (ISO 1996-1:2016). Lden (3.6.4), Ldn (3.6.5) and the composite whole-day rating level of clause 6.5 (Formulae 5-6, Table A.1 adjustments).
- International Organization for Standardization. (2017). Acoustics — Description, measurement and assessment of environmental noise — Part 2: Determination of sound pressure levels (ISO 1996-2:2017). The Clause 10.4 residual-noise correction, the Clause 4 / Annex F measurement uncertainty budget, the Annex J Table J.1 mean-audibility mapping and the Annex K survey method.